Debug Logging
AM services capture a variety of information in debug logs. Unlike audit log records, debug log records are unstructured. Debug logs contain a variety of types of information that is useful when troubleshooting AM, including stack traces.
AM uses Logback as the handler for debug logging, making it easily customizable. For example, the level of debug log record output is configurable, as is the storage location and format.
AM lets you enable the debug log level for specific classes in the AM code base. This can be useful when you must turn on debug logging in a production system where you want to avoid excessive logging, but must gather messages when you reproduce a problem.
You can choose the level of logging from the following options:
OffNo debug messages are logged.
ErrorDebug messages signifying that an error has occurred are logged.
WarningDebug messages signifying potentially harmful situations are logged.
InformationDebug messages that contain coarse-grained information about the status of AM are logged.
DebugDebug messages that contain fine-grained information useful for troubleshooting AM are logged.
This is the default level.
TraceAll debug messages are logged.
Create loggers to specify the debug level for a class, and choose where the output is recorded. The logger used by a feature in AM is hierarchical, based on the class that is creating the debug messages. The most specific logger is used, which is the logger whose path most closely matches the class that is creating the log messages.
For example, if you knew there was an issue in an authentication module, you might enable trace-level debug logging in org.forgerock.openam.authentication.modules. If you are not sure where the problem lies, you may choose a broader option, for example org.forgerock.openam.authentication.
The least-specific, catch-all logger is named ROOT.
AM also logs information related to client interactions using the org.apache.http.wire and org.apache.http.headers appenders. The information they collect is useful, for example, when you are developing authentications scripts or when your environment requires STS transformations.
By default, these appenders are always set to the Warning level unless logging is disabled. For more information, see the org.forgerock.allow.http.client.debug advanced server property.
You can configure debug logging temporarily by using the AM console, or you can create a file in the AM classpath with persistent debug configuration. See the following procedures:
Temporary Debug Logging with Logback.jsp
Configuring Logback.jsp lets you temporarily capture debug messages until the next time AM or the container in which it runs is restarted.
Follow these steps to view and set logging levels in Logback.jsp.
In the AM console, go to
Logback.jspin the root context of the AM installation, for examplehttps://openam.example.com:8443/openam/Logback.jsp.No links to this page are provided in the AM console.
Important
Only the
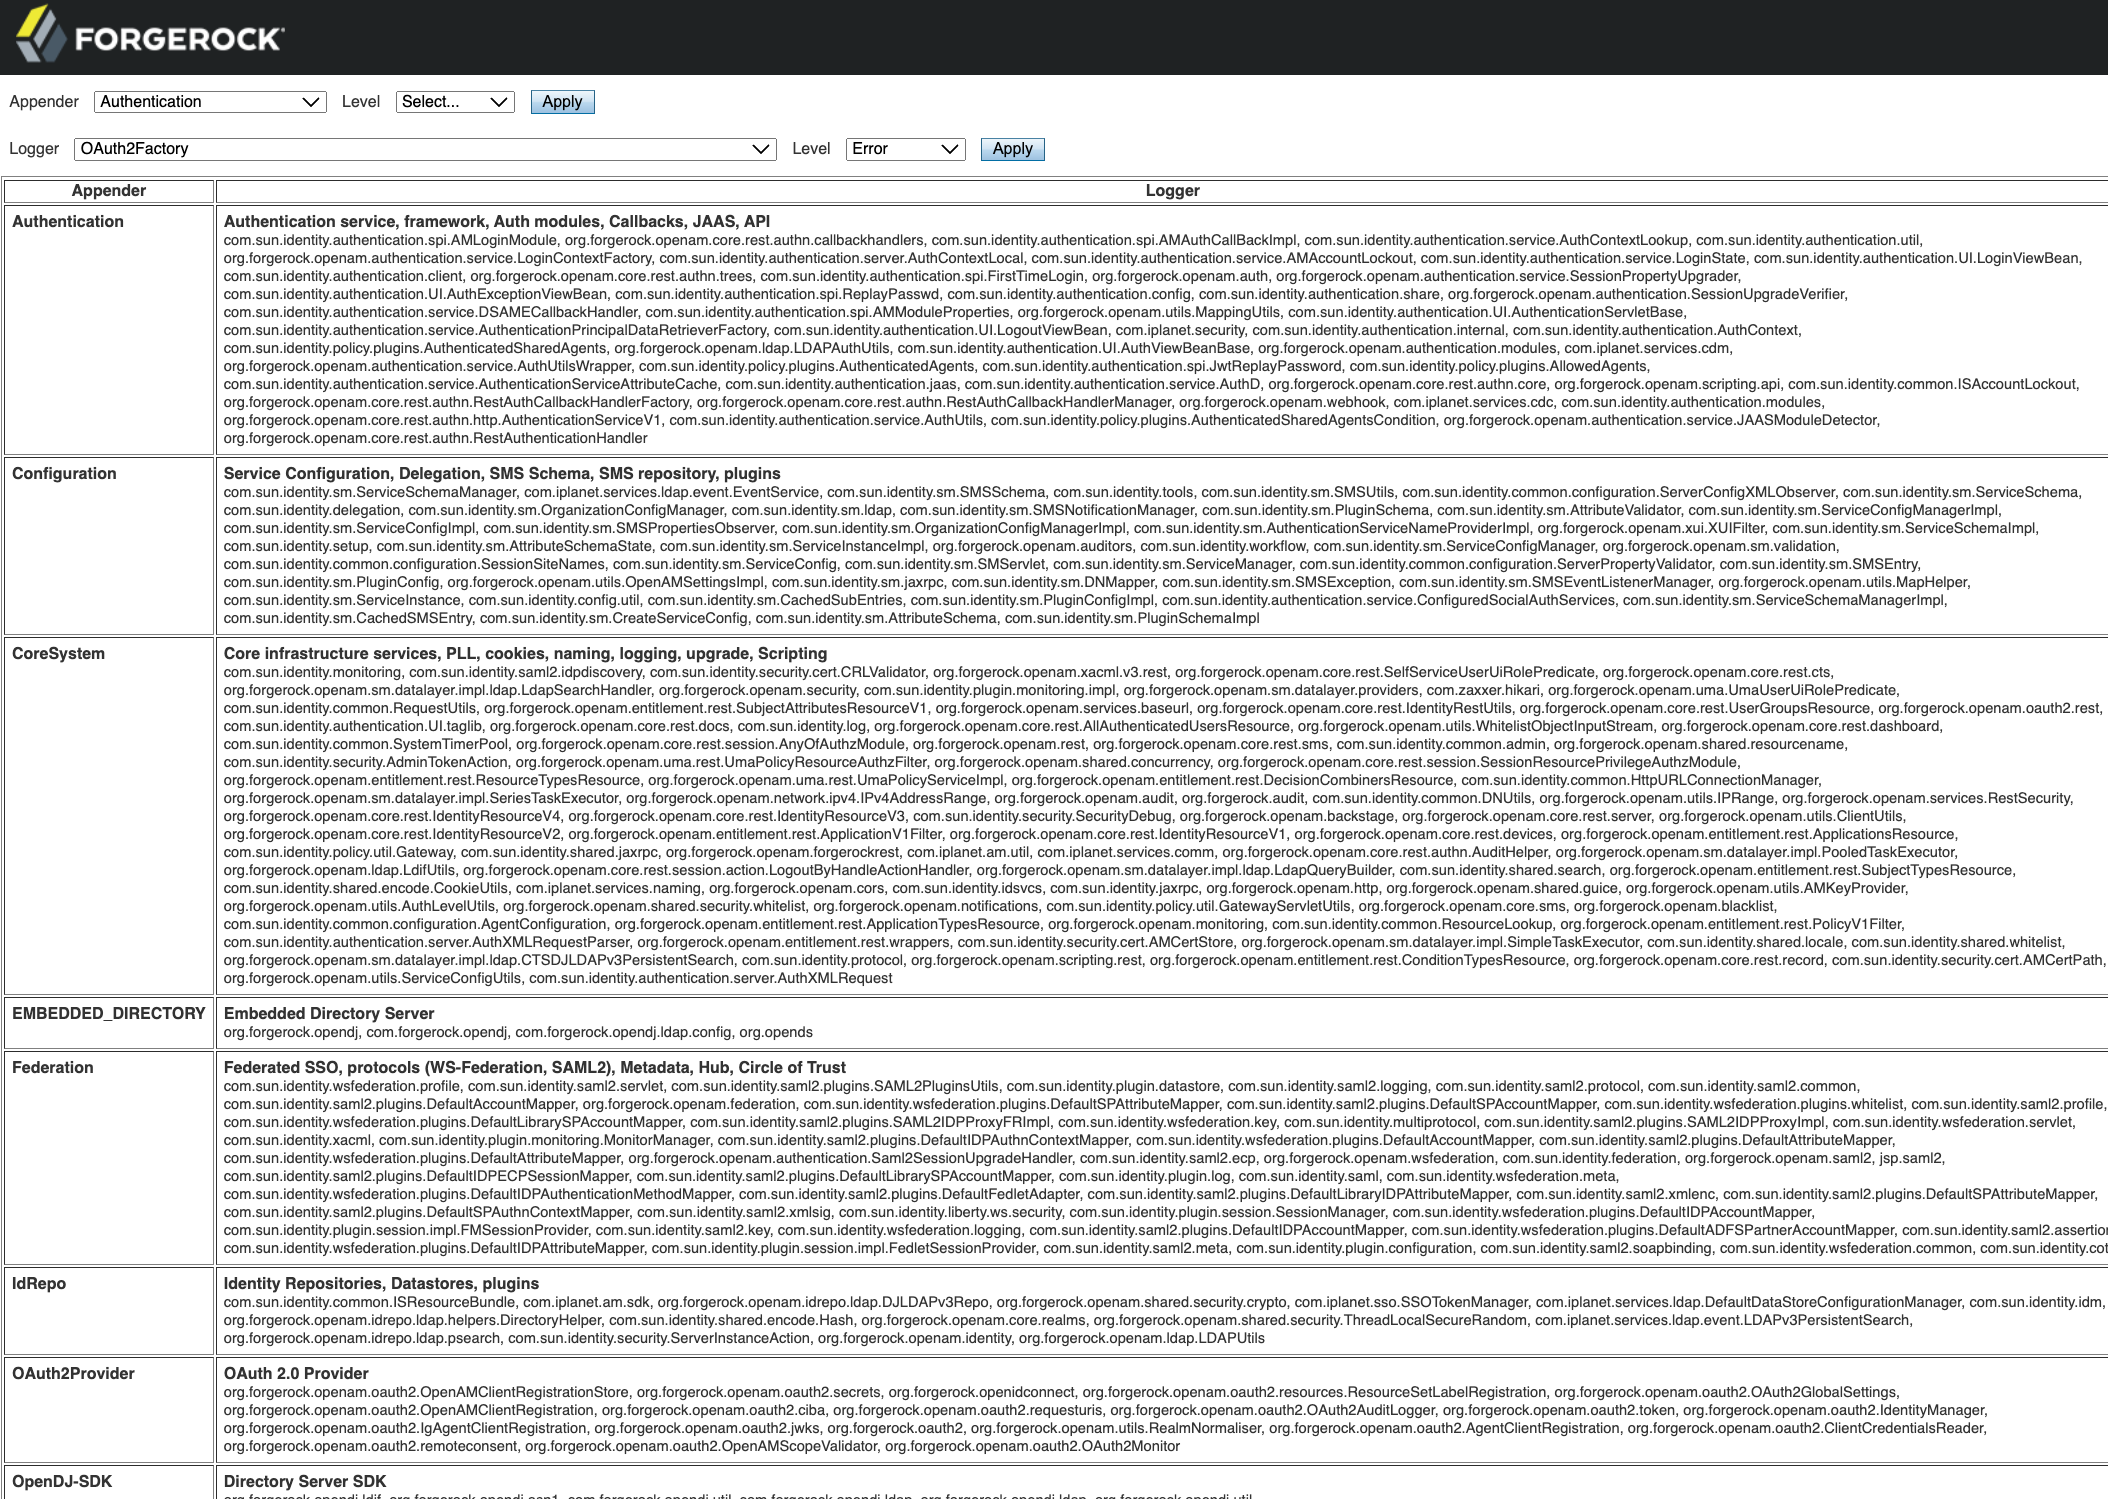
amAdminadministrator account can access theLogback.jsppage and alter the debug settings; delegated administrators do not have access.The page displays all the appenders and their associated debug loggers:
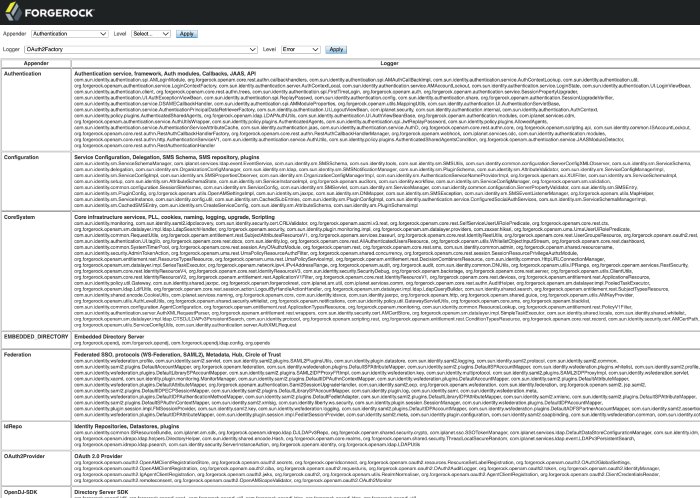
To set the logging level for all loggers that output to a particular appender:
Select the name of the appender from the Appender drop-down list.
Select the debug level from the Level drop-down list.
Click Apply.
To set the logging level for a class or package:
Select the name of the individual logger from the Logger drop-down list, or select the global
ROOTlogger to set the level for all loggers.The current debug level is shown in the Level field.
Note
Any scripts that create debug messages have their own logger, which is only created after the script has executed at least once.
The name of the logger has the format:
scripts.script_type.script_UUID.For example,
scripts.POLICY_CONDITION.9de3eb62-f131-4fac-a294-7bd170fd4acb.Select a new debug level from the Level drop-down list.
Click Apply.
When you apply any changes to the logger settings, a
Logger settings updatedmessage is shown at the top of theLogback.jsppage.Important
Changes made in
Logback.jspapply immediately, but are not permanently stored. Restarting AM or the container in which it runs will reset the levels to defaults.You can configure the default settings that will be applied when AM starts up. See "Altering the Startup Debug Settings".
As soon as you have reproduced the problem you are investigating, return to the
Logback.jsppage and revert the logger levels to the previous settings, to avoid filling up disk space.
Persistent Debug Logging with Logback.xml
Debug logging can be enabled and persisted in AM by configuring a logback.xml file. The file describes the classes to capture the debug messages for, and the destination, or appender where the output is stored. For more information about configuring Logback, see Logback configuration in the Logback Documentation.
This section contains the following procedures:
Perform the following steps to configure a basic, persistent debug logging setup in AM using a logback.xml file:
Create a
logback.xmlfile in the AM classpath, for example in/path/to/tomcat/webapps/openam/WEB-INF/classes/.In the
logback.xmlfile, add an empty, top-level element namedconfiguration.For example:
<configuration>
</configuration>
This element contains the configuration of the loggers and appenders, covered in later steps.
(Optional) To instruct AM to periodically check the
logback.xmlfile for changes, and apply them to the running instance, add both ascanand ascanPeriodattribute to the<configuration>element. For example:<configuration scan="true" scanPeriod="30 seconds"> </configuration>Tip
If AM is not configured to scan the
logback.xmlfile for changes, you will need to reboot the instance in order to pick up any changes.You can set the
scanPeriodattribute to a longer time period, for example one hour, so that rebooting a running system is not required when you need to alter the debugging level.For more information, see Automatically reloading configuration file upon modification in the Logback Documentation.
(Optional) To troubleshoot issues when configuring debug logging using the
logback.xmlfile, add adebugattribute, set totrue, to the<configuration>element. For example:<configuration debug="true"> </configuration>AM will record debug logging status information to the default log file for the container in which it is running. For example, in Tomcat, status messages about the configuration of logback will be recorded in the
Catalina.outfile.For more information, see Status data in the Logback Documentation.
Inside the
<configuration>element, add the definition of one or more appenders. The following example appender logs messages to a file nameddebug.outin the default AM debug directory:<configuration> <appender name="DEBUG.OUT" class="ch.qos.logback.core.FileAppender"> <file>openam/var/debug/debug.out</file> <encoder> <pattern>%lo{5}: %d{ISO8601}: Thread[%t]: TransactionId[%X{transactionId}]%n%level: %m%n%ex</pattern> </encoder> </appender> </configuration>The pattern in the above example creates debug log entries that are identical to the output produced by previous versions of AM, including the transaction ID to aid with tracking events as they occur throughout the system.
Inside the
<configuration>element, add the definition of one or more loggers.Loggers specify which classes to capture debug messages from, including any sub-classes. They also specify the level of debug information to capture, and which of the specified appenders is used to store the output.
The following example logger applies the
Debuglevel to thescripts.POLICY_CONDITIONclass and its sub-classes. The output is recorded in the file specified in thedebug.outappender, created in a previous step:<configuration> <appender name="DEBUG.OUT" class="ch.qos.logback.core.FileAppender"> <file>openam/var/debug/debug.out</file> <encoder> <pattern>%lo{5}: %d{ISO8601}: Thread[%t]: TransactionId[%X{transactionId}]%n%level: %m%n%ex</pattern> </encoder> </appender> <logger name="scripts.POLICY_CONDITION" level="Debug" > <appender-ref ref="DEBUG.OUT" /> </logger> </configuration>(Optional) Inside the
<configuration>element, add arootcatch-all logger, to specify the global level of debug logging to all classes that do not match any of the loggers created in the previous step:<configuration> <appender name="DEBUG.OUT" class="ch.qos.logback.core.FileAppender"> <file>openam/var/debug/debug.out</file> <encoder> <pattern>%lo{5}: %d{ISO8601}: Thread[%t]: TransactionId[%X{transactionId}]%n%level: %m%n%ex</pattern> </encoder> </appender> <logger name="scripts.POLICY_CONDITION" level="Debug" > <appender-ref ref="DEBUG.OUT" /> </logger> <root level="Error"> <appender-ref ref="DEBUG.OUT" /> </root> </configuration>Save your changes.
The changes will be applied the next time you reboot AM or the container in which it runs.
Note
If you are editing an existing
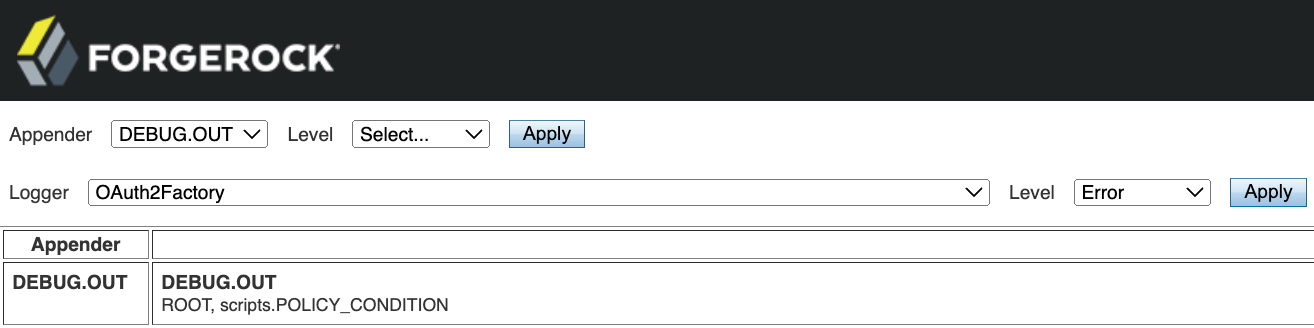
logback.xmlthat AM has already loaded, and contains thescan="true"attribute, you do not need to reboot. Instead wait for the amount of time specified in thescanPeriodattribute and the new configuration will be loaded into AM.(Optional) To verify that the configuration from the
logback.xmlfile has loaded, navigate to theLogback.jspfile, for example athttps://openam.example.com:8443/openam/Logback.jsp, which reflects the configuration found: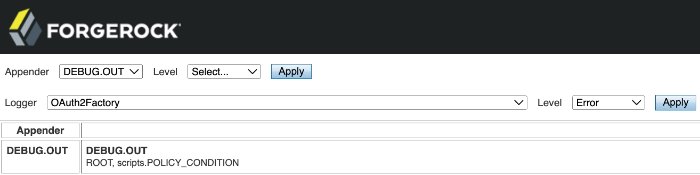
Note that any changes made in the
Logback.jspare temporary, and are not persisted to thelogback.xmlfile.
Configure logback.xml to send logging to standard output. For example, for Apache Tomcat deployments, console output is typically redirected to the Tomcat logging file, catalina.out.
This example configuration captures all debug-level logging using the default <root> element, and redirects it to the STDOUT appender:
<configuration>
  <appender name="STDOUT" class="ch.qos.logback.core.ConsoleAppender">
    <encoder>
      <pattern>%d{HH:mm:ss.SSS} [%thread] %-5level %logger{36} - %msg%n</pattern>
    </encoder>
  </appender>
  <root level="Debug">
    <appender-ref ref="STDOUT" />
  </root>
</configuration>
To configure this example, create the following elements:
An
<appender>that uses thech.qos.logback.core.ConsoleAppenderclass.A
<logger>, or a<root>element as shown here, referencing the STDOUT appender.
Save your changes as described in "To Configure Basic Debug Logging".
Check that debug logging is now output to stdout. For example:
tail -f $TOMCAT_HOME/logs/catalina.out
You can direct debug logging to more than one output location by defining multiple appenders and loggers. Note that you can define only one root element.
This example defines loggers for the scripts.POLICY_CONDITION and scripts.OAUTH2_VALIDATE_SCOPE classes and subclasses that output debug logging to file, using the DEBUG.OUT appender.
All debug-level logging is also directed to standard output using the STDOUT appender.
<configuration>
  <appender name="DEBUG.OUT" class="ch.qos.logback.core.FileAppender">
    <file>openam/var/debug/debug.out</file>
    <encoder>
      <pattern>%lo{5}: %d{ISO8601}: Thread[%t]: TransactionId[%X{transactionId}]%n%level: %m%n%ex</pattern>
    </encoder>
  </appender>
  <appender name="STDOUT" class="ch.qos.logback.core.ConsoleAppender">
    <encoder>
      <pattern>%d{HH:mm:ss.SSS} [%thread] %-5level %logger{36} - %msg%n</pattern>
    </encoder>
  </appender>
  <logger name="scripts.OAUTH2_VALIDATE_SCOPE" level="Debug" >
      <appender-ref ref="DEBUG.OUT" />
    </logger>
  <logger name="scripts.POLICY_CONDITION" level="Debug" >
    <appender-ref ref="DEBUG.OUT" />
  </logger>
  <root level="Debug">
    <appender-ref ref="STDOUT" />
  </root>
</configuration>
To configure this example, create the following elements:
An
<appender>that uses thech.qos.logback.core.FileAppenderclass.An
<appender>that uses thech.qos.logback.core.ConsoleAppenderclass.A
<logger>for each of the script types, referencing the DEBUG.OUT appender.A
<logger>, or a<root>element as shown here, referencing the STDOUT appender.
Save your changes as described in "To Configure Basic Debug Logging".
The org.forgerock.openam.logback.JsonLayout class extends Logback JSON layout functionality by adding the transaction ID to the JSON output.
This example shows how you can include the JsonLayout class to format your log files:
<configuration>
  <appender name="DEBUG.OUT" class="ch.qos.logback.core.FileAppender">
    <file>openam/var/debug/debug.out</file>
    <encoder>
      <pattern>%lo{5}: %d{ISO8601}: Thread[%t]: TransactionId[%X{transactionId}]%n%level: %m%n%ex</pattern>
    </encoder>
  </appender>
  <appender name="STDOUT" class="ch.qos.logback.core.ConsoleAppender">
    <encoder>
      <pattern>%d{HH:mm:ss.SSS} [%thread] %-5level %logger{36} - %msg%n</pattern>
    </encoder>
  </appender>
  <logger name="scripts.OAUTH2_VALIDATE_SCOPE" level="Debug" >
      <appender-ref ref="DEBUG.OUT" />
    </logger>
  <logger name="scripts.POLICY_CONDITION" level="Debug" >
    <appender-ref ref="DEBUG.OUT" />
  </logger>
  <root level="Debug">
    <appender-ref ref="STDOUT" />
  </root>
</configuration>
To configure this example, create the following elements:
An
<appender>that uses thech.qos.logback.core.rolling.RollingFileAppenderclass.An
<encoder>that uses thech.qos.logback.core.encoder.LayoutWrappingEncoderclass.A
<layout>element that uses theorg.forgerock.openam.logback.JsonLayoutclass.A
<jsonFormatter>element that uses thech.qos.logback.contrib.jackson.JacksonJsonFormatterclass.
Save and verify your changes as described in "To Configure Basic Debug Logging".
The use of the JsonLayout class results in the addition of a
transactionIdat the top level of the log entry. For example:{ "timestamp" : "2022-07-28 15:39:44.562", "level" : "DEBUG", "thread" : "http-nio-8080-exec-6", "mdc" : { "transactionId" : "eb0664cc-4615-461e-973a-64a1fc4f659a-34695" }, "logger" : "org.forgerock.openam.rest.restAuthenticationFilter", "message" : "OpenAM SSO Token Session Module has successfully authenticated the client", "context" : "default", "transactionId" : "eb0664cc-4615-461e-973a-64a1fc4f659a-34695" }
Logback provides built-in support for a number of log file rotation schemes, for example both time and size based rotation. If you have configured AM with a logback.xml file, you can configure log file rotation in the appenders, by performing the following steps:
Edit the
logback.xmlfile you created in the AM classpath, for example in/path/to/tomcat/webapps/openam/WEB-INF/classes/.If you need to create the file, see "To Configure Basic Debug Logging".
In the
<configuration>element, create an appender that uses thech.qos.logback.core.rolling.RollingFileAppenderclass, for example:<appender name="DAILYLOG" class="ch.qos.logback.core.rolling.RollingFileAppender"> <encoder> <pattern>%lo{5}: %d{ISO8601}: Thread[%t]: TransactionId[%X{transactionId}]%n%level: %m%n%ex</pattern> </encoder> </appender>Within the appender, specify whether to rotate based on time, and optionally also size, as follows:
(Optional) To rotate the log files based only on time, add a
<rollingPolicy>element to the appender, which uses thech.qos.logback.core.rolling.TimeBasedRollingPolicyclass.Include a
<fileNamePattern>element that defines when the log files should roll over, and the naming convention.For example, the following appender rolls the log file over at midnight each day, and includes the date in the filename:
<appender name="DAILYLOG" class="ch.qos.logback.core.rolling.RollingFileAppender">
  <rollingPolicy class="ch.qos.logback.core.rolling.TimeBasedRollingPolicy">
    <fileNamePattern>openam/var/debug/dailyLog.%d{yyyy-MM-dd}.log</fileNamePattern>
  </rollingPolicy>
  <encoder>
    <pattern>%lo{5}: %d{ISO8601}: Thread[%t]: TransactionId[%X{transactionId}]%n%level: %m%n%ex</pattern>
  </encoder>
</appender>
(Optional) To rotate the log files based on both time and size, add a
<rollingPolicy>element to the appender, which uses thech.qos.logback.core.rolling.SizeAndTimeBasedRollingPolicyclass.Include a
<fileNamePattern>element that defines when the log files should roll over, and where the counter for rolling over based on size occurs, specified by including%i. You must also include a<maxFileSize>element to define the maximum size of the log files.For example, the following appender rolls the log file over at midnight each day, but earlier if the file reaches 2 gigabytes in size, and includes the date in the filename:
<appender name="DAILYLOG2GB" class="ch.qos.logback.core.rolling.RollingFileAppender">
  <rollingPolicy class="ch.qos.logback.core.rolling.SizeAndTimeBasedRollingPolicy">
    <fileNamePattern>openam/var/debug/dailyLog2GB.%d{yyyy-MM-dd}-%i.log</fileNamePattern>
    <maxFileSize>2GB</maxFileSize>
  </rollingPolicy>
  <encoder>
    <pattern>%lo{5}: %d{ISO8601}: Thread[%t]: TransactionId[%X{transactionId}]%n%level: %m%n%ex</pattern>
  </encoder>
</appender>
Save your changes.
The changes will be applied the next time you reboot AM or the container in which it runs.
Note
If you are editing an existing
logback.xmlthat AM has already loaded, and contains thescan="true"attribute, you do not need to reboot. Instead wait for the amount of time specified in thescanPeriodattribute and the new configuration will be loaded into AM.Debug log files will roll over each night, and also if they reach the 2GB size limit. The file names will contain the date, and a counter to signify the order in which they were written.
Altering the Startup Debug Settings
You can configure the settings that will be applied when AM starts up and there is no logback.xml file present.
The settings specified as defaults will be reflected in the Logback.jsp file, for example at https://openam.example.com:8443/openam/Logback.jsp. However, they will not override the configuration contained with a custom logback.xml file.
This section contains the following procedures:
Perform the following steps to set the default debug level used by all loggers when AM starts up:
In the AM console, go to Deployment > Servers > Server Name > General > Debugging.
Select an option from the Debug Level field.
The default level for debug logging is
Error. This level is appropriate for normal production operations, in which case no debug log messages are expected.Setting the debug log level to
Warningincreases the volume of messages. Setting the debug log level toMessagedumps detailed trace messages.Unless told to do so by qualified support personnel, do not use
WarningorMessagelevels as a default in production. Instead, set the levels on a per-class basis. See Debug Logging.Save your changes.
Changes are applied immediately.
Perform the following steps to set the default directory used to store debug log files:
In the AM console, go to Deployment > Servers > Server Name > General > Debugging.
Enter a directory in which to store log files in the Debug Directory field.
The default level for debug logging is
Error. This level is appropriate for normal production operations, in which case no debug log messages are expected.The default value is
%BASE_DIR%/%SERVER_URI%/debug. The%BASE_DIR%value equates to the folder containing the AM local configuration, for example/path/to/openam. The%SERVER_URI%value equates to the deployment URI used when deploying AM, for example/openam.Therefore, the default location for the debug logs resembles the following:
/path/to/openam/var/debug/.Important
Ensure that the specified folder can be written to by the account that is running AM or the container in which it runs.
Save your changes.
The changes will be applied the next time you reboot AM or the container in which it runs.
Perform the following steps to log all debug messages to a single debug.out file:
In the AM console, go to Deployment > Servers > Server Name > General > Debugging.
Set the Merge Debug Files property to On.
Save your changes.
Changes are applied immediately.
All debug log messages will be written to a single debug file named
debug.out. The file will be located in the directory specified in the Debug Directory property. See "To Set the Default Debug Directory".