View Relationships in Graph Form
The Identity Relationships widget gives a visual display of the relationships between objects.
This widget is not displayed on any dashboard by default. You can add it as follows:
Log in to the Admin UI.
Select Dashboards, and choose the dashboard to which you want to add the widget.
Select Add Widget.
In the Add Widget window, scroll down to the Utilities item, select Identity Relationships, then click Settings.
Choose the Widget Size (small, medium, or large).
From the Chart Type list, select Collapsible Tree Layout or Radial Layout.
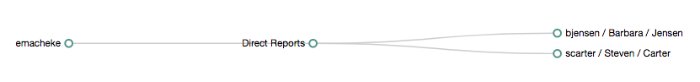
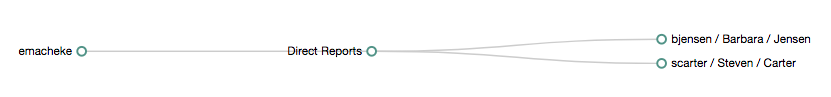
The Collapsible Tree Layout looks something like this:
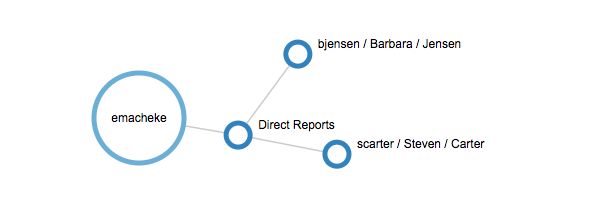
The Radial Layout looks something like this:
Select the object for which you want to display relationships, for example,
User.Select the property or properties that will be used to search on that object, and that will be displayed in the widget, for example,
userNameandcity.Optionally, select Preview for an idea of what the data represented by widget will look like. Select Settings to return to the Add Widget window.
Click Add to add the widget to the dashboard.

When you have added the Identity Relationships widget, select the user whose relationships you want to search.
The following graph shows all of imartinez's relationships. The graph shows imartinez's manager and her direct reports.
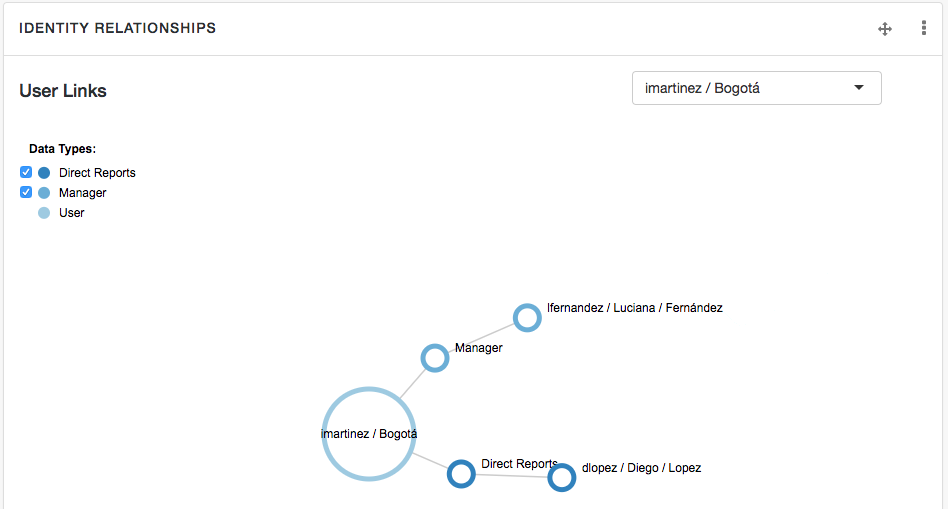
Select or deselect the Data Types on the left of the screen to control how much information is displayed.
Select and move the graph for a better view. Double-click on any user in the graph to view that user's profile.