Kubernetes logs and other diagnostics
Look at pod descriptions and container log files for irregularities that indicate problems.
Pod descriptions contain information about active Kubernetes pods, including their configuration, status, containers (including containers that have finished running), volume mounts, and pod-related events.
Container logs contain startup and run-time messages that might indicate
problem areas. Each Kubernetes container has its own log that contains all
output written to stdout by the application running in the container. The am
container logs are especially important for troubleshooting AM issues in
Kubernetes deployments. AM writes its debug logs to stdout.
Therefore, the am container logs include all the AM debug logs.
debug-logs utility
The debug-logs utility generates the following HTML-formatted output, which you can view in a browser:
-
Descriptions of all the Kubernetes pods running the ForgeRock Identity Platform in your namespace
-
Logs for all of the containers running in these pods
-
Descriptions of the PVCs running in your cluster
-
Operator logs
-
Information about your local environment, including:
-
The Kubernetes context
-
Third-party software versions
-
CRDs installed in your cluster
-
Kubernetes storage classes
-
Your Skaffold configuration
-
The most recent commits in your forgeops repository clone’s commit log
-
Details about a variety of Kubernetes objects on your cluster
-
Example troubleshooting steps
Suppose you installed the CDK, but noticed that one of the CDK
pods had an ImagePullBackOff error at startup. Here’s an example of how you
might use pod descriptions and container logs to troubleshoot the problem:
-
Make sure that the active namespace in your local Kubernetes context is the one that contains the component you are debugging.
-
Make sure you’ve checked out the release/7.2-20240117 branch of the
forgeopsrepository. -
Change to the /path/to/forgeops/bin directory in your
forgeopsrepository clone. -
Run the debug-logs command:
$ ./debug-logs
Writing environment information
Writing pod descriptions and container logs
  admin-ui-5ff5c55bd9-vrvrq
  am-7cd8f55b87-nt9hw
  ds-idrepo-0
  end-user-ui-59f84666fb-wzw59
  idm-6db77b6f47-vw9sm
  login-ui-856678c459-5pjm8
Writing PVC descriptions
  data-ds-idrepo-0
Writing operator logs
  secret-agent
  ds-operator
Writing information about various Kubernetes objects
Open /tmp/forgeops/log.html in your browser.
-
In a browser, go to the URL shown in the debug-logs output. In this example, the URL is file:///tmp/forgeops/log.html. The browser displays a screen with a link for each ForgeRock Identity Platform pod in your namespace:
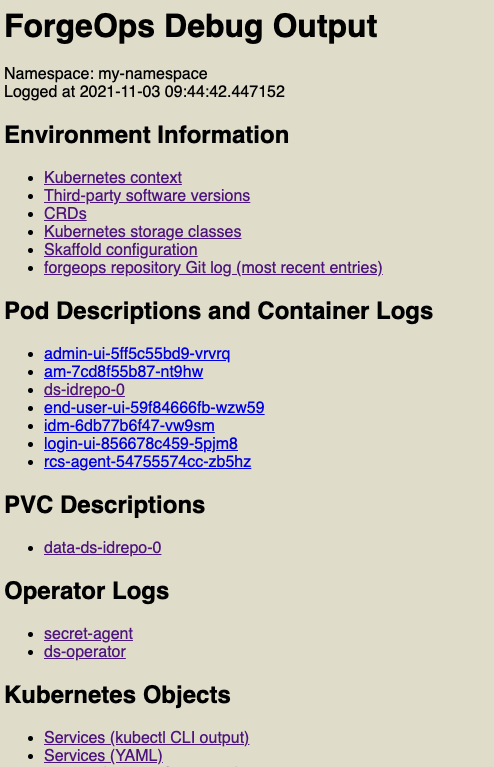
-
Access the information for the pod that didn’t start correctly by selecting its link from the Pod Descriptions and Container Logs section of the debug-logs output.
Selecting the link takes you to the pod’s description. Logs for each of the pod’s containers follow the pod’s description.
After you’ve obtained the pod descriptions and container logs, here are some actions you might take:
-
Examine each pod’s event log for failures.
-
If a Docker image could not be pulled, verify that the Docker image name and tag are correct. If you are using a private registry, verify that your image pull secret is correct.
-
Examine the init containers. Did each init container complete with a zero (success) exit code? If not, examine the logs from that failed init container using the
kubectl logs pod-xxx -c init-container-namecommand. -
Look at the pods' logs to see if the main container entered a crashloop.