The Autonomous Identity UI
Autonomous Identity provides a powerful UI dashboard, displaying all of your entitlements, attributes, and confidence scores across your company. The UI provides different filtered levels of information depending on the user’s access rights.
Dashboard
The Dashboard, also known as the Company View, provides a complete summary of your company’s entitlements, confidences scores, and entitlement assignments. The page also shows the trend lines of your confidence score history over time. The navigation has a left-hand menu to go through each page. Only admin users and executives can view this page.
See a tour of the Autonomous Identity Dashboard
The Dashboard is partitioned into several modules as you scroll down:
-
Model Coverage. Displays data on model coverage and confidence scoring of the assigned entitlements. The section summarizes the total number of entitlements processed by Autonomous Identity, and the number and percentage of those entitlements that were covered and not covered by the system. The section also displays a summary of entitlement assignments, specifically the number of High Confidence Assignments (90% and above), Low Confidence Assignments (20% and below), total assignments, and number of unscored entitlements. "Unscored" indicates that Autonomous Identity could not learn any patterns for a specific entitlement to properly assign a confidence score to it.
-
Confidence Score Distribution of Entitlements. Displays a histogram of the distribution of confidence scores across your entitlements landscape. The chart provides a good summary of the current state of your entitlements landscape. In general, you want to set up your high confidence-scoring entitlements as candidates for automated approval and certification. You also want to move a good percentage of your middle level confidence scores to high confidence entitlements.
-
User Type. Displays a summary of users versus non-users covered by the system.
-
Most Critical Entitlements. Displays the list of the most critical entitlements with the low average confidence scores and the number of employees with the entitlement. You can drill down to view each entitlement, where you can approve or remove access to the entitlement for that user.
-
All Entitlements Distribution. Displays the number of one-to-one matching and the highly assigned entitlements to distinct users.
-
One-to-one matching indicates the number of entitlement assigned to one user only.
-
Highly Assigned indicates the number of entitlements assigned to users. These highly-assigned entitlements are good candidates for automated access approval or certification using policies or roles.
-
Graph of All Entitlements Distribution displays a chart of the number of entitlements versus the number of users. The number range on the left (e.g., 0-5) indicate the number of entitlements assigned. The number on the right indicates the actual number of users. Thus, in the image below, there are 207 users who have 0-5 assigned entitlements. In the second row from the bottom, there are 979 users who have between 5-10 assigned entitlements. In the third row from the bottom, there are 1451 users who have between 10-100 assigned entitlements. In the fourth row from the bottom, there are 33 users who have betwen 100-1000 assigned entitlements.
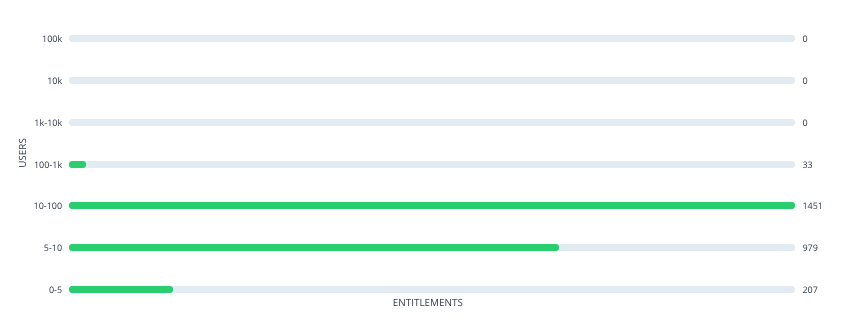 Figure 1. An Example of the All Entitlements Distribution Graph
-
-
Entitlements Without Owners. Displays the number of entitlements without an owner. This indicates that no user is managing this entitlement.
-
Users Without Supervisors. Displays the number of users without a supervisor. This could indicate that a user was not properly set up or deprovisioned on your system.
-
History of Assignment Confidence Scores. Displays a history of assigned confidence scores (high, medium, and low) over the past year versus the number of assignments. This graph shows the confidence score trends over time and indicates how well you are managing your entitlements. In general, you want rising high and mid confidence scores and decreasing low score trends.
Identities
The Identities page, formerly known as the Employee Overview/Supervisor view, displays a supervisor-based view of all user reporting to a specific supervisor and their entitlements. Admin users can see all supervisors and their users, while supervisors can only view their direct reports.
See a tour of the Autonomous Identity Identities Page
The Identities page is partitioned into several modules:
-
Total Number of Entitlements. Displays the total number of entitlements assigned to users who report to the supervisor.
-
Total Number of Users. Displays the total number of users that are assigned the entitlements.
-
Graph of Average Confidence Scores. Displays a chart of the Average Confidence Scores versus the Number of Entitlements. You can hover over each circle to see the user’s name, average confidence score, and number of entitlements assigned. If you double-click a circle, you can see the user’s in the list on the right.
-
Filters. Enable any of the application filters to display only those entitlements for the application. Enable the
Remove High Scores from Averagesfilter to view only the mid and low confidence scores. Click theAdd Filtersbutton to filter the display based on User attributes, such ascity. -
List. Displays a full list of users who have the assigned entitlements and their confidence scores. You can drill down and see each user’s entitlements details by clicking on the user’s name. To search for a specific user in the list, enter their name in the Search box above.
From the Identities page, you can view the user’s detail by clicking a name in the right-hand menu. The User Detail is partitioned into several areas that display the following:
See a tour of the Autonomous Identity User Details Page
-
Not Scored. Click the button to see any entitlements that were not scored by the system. Click Approve to approve or revoke the entitlement for the user.
-
Recommended. Click the button to see any entitlements that were not assigned to the user but are a good candidate for the entitlement based on their attributes.
-
Range of Confidence Scores. Displays the low, medium, and high confidence scores for the assigned entitlements to the user. Click a circle to highlight the entitlement in the list below the graph.
-
Display. Displays a filter that matches any features set in the
Assignmentsentity definition. This filter is also present on the Not Scored and Recommended pages. -
Entitlements. Displays the list of user’s assigned entitlements, the application, and confidence score associated with the entitlement. Admins and supervisors can approve or revoke one or more entitlements for the user.
Click the down arrow to review entitlement details that helps you run the following:
-
Justifications. Displays the attributes that lead to the confidence score.
-
Driving Factor Comparison. Displays a comparison of attributes and the driving factors that lead to a high confidence scored compared to the user’s attribute values.
-
Employees associated with the entitlement. Displays the users, justifications, and confidence scores of users who also have the recommended entitlement.
-
-
User Detail. Displays the user’s attributes as ingested from the company’s HR database.
Applications
The Applications page provides an app-centric view for application owners and admin users to view the entitlements and assignments for an application. Admin users must enter the application owner to view the entitlement information on an application.
See a tour of the Autonomous Identity User Entitlements Detail Page

The Applications page is partitioned into several modules:
-
Total Number of Applications. Displays the total number of applications for the application owner.
-
Total Number of Entitlements. Displays the total number of entitlements that are associated with the applications.
-
Total Number of Assignments. Displays the total number of entitlement assignments that are associated with the applications.
-
Graph of Average Confidence Scores. Displays the Average Confidence Scores versus the Number of Assignments. You can hover over each circle to see the application’s name, average confidence score, and number of users assigned to the application. If you double-click a circle, you can highlight an application on the right-hand list the list.
-
List of Application and Confidence Scores. Displays the list of applications and confidence scores. If you click an application, you can drill down to the Application Detail page to see more information. To search through your list, enter an application name to access it.
Application Details page is partitioned into several modules:
See a tour of the Autonomous Identity Application Detail Page
-
Total Number of Entitlements. Displays the total number of entitlements associated with the application.
-
Total Number of Users. Displays the total number of users who have access to the application.
-
Total Number of Rules. Displays the total number of rules that are associated with the application.
-
Filters. Displays options to filter the data based on entitlement attributes and user attributes.
Click here to see a description of the filters
The Application filters let you filter the viewable entitlements based on the following attributes:
-
Owner. Filters the entitlements based on entitlement owner.
-
Risk Level. Filters the entitlements based on risk level: low, medium, and high.
-
Criticality. Filters the entitlements based on criticality of the entitlement: Essential or Non-Essential.
You can also filter based on driving factor attributes:
-
Manager Name. Filters based on the manager’s name. The menu displays the managers associated with the users who are assigned entitlements for the application.
-
Chief. Filters based on if the user is a manager or not.
-
User Department Name. Filters based on the department name. The menu displays the departments associated with the users who are assigned entitlements for the application.
-
Line of Business Subgroup. Filters based on the Line of Business Subgroup. The menu displays the subgroups associatedwith the users who are assigned entitlements for the application.
-
Line of Business. Filters based on the Line of Business. The menu displays the line of businesses associated with the users who are assigned entitlements for the application.
-
Cost Center. Filters based on the cost center. The menu displays the cost centers associated with the users who are assigned entitlements for the application.
-
Job Code Name. Filters based on the job code name. The menu displays the job code names associated with the users who are assigned entitlements for the application.
-
City Filters based on the city. The menu displays the cities associated with the users who are assigned entitlements for the application.
-
User Employee Type. Filters on user employee type, either
EmployeeandNon-Employee.
-
-
Graph of Average Confidence Scores. Displays the Average Confidence Scores versus the Number of Users. You have the option to view bubbles or a list view. You can hover over each circle to see the application’s name to highlight it on the right-hand list. If you click list view, you can see the entitlement, user, confidence scores and an option to re-certify the entitlement for the user to access the application.
-
List of Entitlements and Confidence Scores. Displays the list of entitlements and confidence scores for the application. If you click an entitlement, you can drill down to the Entitlement Detail page to see more information. To search for a specific entitlement, enter its name in the Search box.
Entitlements
The Entitlements page provides an entitlement-centric view of an owner’s entitlements. Entitlement owners cannot see the entitlements of other owners. Admin users can access this page and must enter an entitlement owner to view a specific entitlement.
See a tour of the Autonomous Identity Entitlements Page
The Entitlements page is partitioned into several modules as you scroll down:
-
Total Number of Entitlements. Displays the total number of entitlements that the entitlement owner has responsibility for.
-
Total Number of Users. Displays the total number of users that are assigned to the entitlements.
-
Graph of Average Confidence Scores. Displays the Average Confidence Scores versus the Number of Users. You can hover over each circle to see the entitlement’s name, average confidence score, and number of users with the assigned entitlement. If you double-click a circle, you can see the entitlement on the list on the right.
-
Filters. Enable the
Remove High Scores from Averagesfilter to view only the mid and low confidence scores. You can also filter based on one or more applications. Click Add Filters to further filter based on a user attribute, such ascity. -
List of Entitlements. Displays a full list of entitlements and its average confidence score. You can drill down to see the details by clicking on the entitlement’s name. To search for an entitlement, enter it in the Search box.
When you drill down to view a specific entitlement, the entitlement detail page is displayed with the following sections:
See a tour of the Autonomous Identity Entitlements Page
-
Average Confidence Score. Displays the average confidence score for the entitlement.
-
Distribution of Users. Displays the total number of users with the entitlements and the breakdown of low, medium, and high confidence scores.
-
Driving Factors. Displays the driving factors, the attributes that lead to the confidence score. You can click the down arrow to see more information.
-
Graph of Average Confidence Score. Displays a graph of the average confidence score versus the number of users with the confidence score. You can click one of the bars to highlight the justifications on the right-hand list.
-
List of Justifications. Displays a list of justifications with the number of users and average confidence scores. You can click the right arrow to see the users with this entitlement and justifications. The checkbox next to each justification set lets you approve it. If you click a user’s name, you can drill down to see the User Entitlements Detail page, which provides more detailed information from the user perspective.
Rules
The Rules page displays a rules-centric view of the entitlements for application and entitlement owners. Admin users must search for an application or entitlement owner to view a rule.
See a tour of the Autonomous Identity Rules Page
The Rules page is partitioned into several modules as you scroll down:
-
Total Number of Rules. Displays the total number of rules that the entitlement owner has responsibility for.
-
Total Number of Identities. Displays the total number of identities that are assigned the entitlements.
-
Total Number of Applications. Displays the total number of applications that are associated with the rules.
-
Filters. Click Filters to view a segment of the total list. You can hide already reviewed auto-certified or auto-approved rules, low, medium, and high confidence scores, and by applications.
-
List of Entitlements and Justifications. Displays the list of entitlements and their justifications. Entitlements with more than three justification attributes displays a
Show morelink. Application and entitlement owners can approve the entitlement based on the information displayed.Click the down arrow on the right to view the user attributes, driving factors, and values for a specific identity. If more than one users exists for that rule, you can change the user under the Identity drop-down list. The icons on the right indicate if a justification is appropriate for the entitlement or not. You can drill down to see the user’s details by clicking the View <identity>.