Monitoring
IDM includes the following tools for monitoring metrics:
-
A Dropwizard dashboard widget, for viewing metrics within IDM.
-
A Prometheus endpoint, for viewing metrics through external resources such as Prometheus and Grafana.
Enable metrics
IDM does not collect metrics by default. To enable metrics collection, open conf/metrics.json and set the enabled property to true:
{
    "enabled" : true
}
After you have enabled metrics, the following command returns all collected metrics:
curl \
--header "X-OpenIDM-Username: openidm-admin" \
--header "X-OpenIDM-Password: openidm-admin" \
--header "Accept-API-Version: resource=1.0" \
--request GET \
'http://localhost:8080/openidm/metrics/api?_queryFilter=true'
Show example response
{
  "result": [
    {
      "_id": "jvm.memory-usage.pools.Metaspace.used",
      "value": 101709640,
      "_type": "gauge"
    },
    {
      "_id": "jvm.memory-usage.non-heap.used",
      "value": 159728512,
      "_type": "gauge"
    },
    {
      "_id": "repo.ds.get-connection",
      "count": 25,
      "max": 13.407542,
      "mean": 7.016551422258608,
      "min": 2.274208,
      "p50": 7.038666999999999,
      "p75": 8.653042,
      "p95": 12.613916999999999,
      "p98": 13.407542,
      "p99": 13.407542,
      "p999": 13.407542,
      "stddev": 3.0043480716919446,
      "m15_rate": 1.00220378348439,
      "m1_rate": 1.0294250758954837,
      "m5_rate": 1.0065021413358448,
      "mean_rate": 1.173715776010422,
      "duration_units": "milliseconds",
      "rate_units": "calls/second",
      "total": 174.284168,
      "_type": "timer"
    },
    {
      "_id": "jvm.memory-usage.pools.G1-Old-Gen.committed",
      "value": 794820608,
      "_type": "gauge"
    },
    {
      "_id": "user.session.static-user",
      "m15_rate": 0.19780232116334415,
      "m1_rate": 0.17175127368841633,
      "m5_rate": 0.1935515941358193,
      "mean_rate": 0.09993098620692964,
      "units": "events/second",
      "total": 2,
      "count": 2,
      "_type": "summary"
    },
    {
      "_id": "jvm.max-memory",
      "value": 2147483648,
      "_type": "gauge"
    },
    {
      "_id": "jvm.memory-usage.pools.Compressed-Class-Space.usage",
      "value": 0.015285782516002655,
      "_type": "gauge"
    },
    {
      "_id": "jvm.memory-usage.pools.CodeHeap-'non-profiled-nmethods'.init",
      "value": 2555904,
      "_type": "gauge"
    },
    {
      "_id": "jvm.memory-usage.non-heap.usage",
      "value": -233855696,
      "_type": "gauge"
    },
    {
      "_id": "jvm.memory-usage.pools.G1-Old-Gen.init",
      "value": 2034237440,
      "_type": "gauge"
    },
    {
      "_id": "jvm.memory-usage.total.max",
      "value": 2147483647,
      "_type": "gauge"
    },
    {
      "_id": "jvm.memory-usage.total.committed",
      "value": 2399019008,
      "_type": "gauge"
    },
    {
      "_id": "jvm.memory-usage.heap.init",
      "value": 2147483648,
      "_type": "gauge"
    },
    {
      "_id": "repo.ds.update.cluster",
      "count": 5,
      "max": 13.490832999999999,
      "mean": 11.40983226004801,
      "min": 8.795417,
      "p50": 10.932459,
      "p75": 12.708499999999999,
      "p95": 13.490832999999999,
      "p98": 13.490832999999999,
      "p99": 13.490832999999999,
      "p999": 13.490832999999999,
      "stddev": 1.594812363576534,
      "m15_rate": 0.2011018917421949,
      "m1_rate": 0.21471253794774184,
      "m5_rate": 0.2032510706679223,
      "mean_rate": 0.23483436767444082,
      "duration_units": "milliseconds",
      "rate_units": "calls/second",
      "total": 56.608459,
      "_type": "timer"
    },
    {
      "_id": "repo.ds.read.cluster",
      "count": 5,
      "max": 13.253,
      "mean": 9.663193140378318,
      "min": 6.366667,
      "p50": 10.924292,
      "p75": 11.00375,
      "p95": 13.253,
      "p98": 13.253,
      "p99": 13.253,
      "p999": 13.253,
      "stddev": 2.480672375020272,
      "m15_rate": 0.19999386134317423,
      "m1_rate": 0.1987214208736065,
      "m5_rate": 0.19994536143224584,
      "mean_rate": 0.23467002606408544,
      "duration_units": "milliseconds",
      "rate_units": "calls/second",
      "total": 49.324167,
      "_type": "timer"
    },
    {
      "_id": "jvm.memory-usage.pools.CodeHeap-'profiled-nmethods'.init",
      "value": 2555904,
      "_type": "gauge"
    },
    {
      "_id": "jvm.memory-usage.pools.CodeHeap-'non-nmethods'.usage",
      "value": 0.42355263157894735,
      "_type": "gauge"
    },
    {
      "_id": "jvm.memory-usage.pools.Compressed-Class-Space.init",
      "value": 0,
      "_type": "gauge"
    },
    {
      "_id": "jvm.memory-usage.pools.G1-Old-Gen.used",
      "value": 137279336,
      "_type": "gauge"
    },
    {
      "_id": "jvm.thread-state.timed_waiting.count",
      "value": 84,
      "_type": "gauge"
    },
    {
      "_id": "jvm.memory-usage.pools.G1-Old-Gen.usage",
      "value": 0.08353511989116669,
      "_type": "gauge"
    },
    {
      "_id": "jvm.memory-usage.pools.Metaspace.init",
      "value": 0,
      "_type": "gauge"
    },
    {
      "_id": "jvm.memory-usage.pools.G1-Survivor-Space.committed",
      "value": 52428800,
      "_type": "gauge"
    },
    {
      "_id": "jvm.memory-usage.pools.CodeHeap-'non-profiled-nmethods'.usage",
      "value": 0.12785444714742736,
      "_type": "gauge"
    },
    {
      "_id": "jvm.memory-usage.heap.usage",
      "value": 0.5991601198911667,
      "_type": "gauge"
    },
    {
      "_id": "jvm.garbage-collector.G1-Old-Generation.count",
      "value": 4,
      "_type": "gauge"
    },
    {
      "_id": "jvm.garbage-collector.G1-Young-Generation.count",
      "value": 18,
      "_type": "gauge"
    },
    {
      "_id": "jvm.thread-state.waiting.count",
      "value": 50,
      "_type": "gauge"
    },
    {
      "_id": "jvm.class-loading.loaded",
      "value": 22747,
      "_type": "gauge"
    },
    {
      "_id": "jvm.thread-state.terminated.count",
      "value": 0,
      "_type": "gauge"
    },
    {
      "_id": "jvm.available-cpus",
      "value": 10,
      "_type": "gauge"
    },
    {
      "_id": "jvm.garbage-collector.G1-Old-Generation.time",
      "value": 360,
      "_type": "gauge"
    },
    {
      "_id": "filter.scripted.on-request.d6fc81179beaca37094a23c2fcd00aaf54bb3ef9:router:onRequest",
      "count": 2,
      "max": 21.174791,
      "mean": 16.456464351980753,
      "min": 12.961041999999999,
      "p50": 12.961041999999999,
      "p75": 21.174791,
      "p95": 21.174791,
      "p98": 21.174791,
      "p99": 21.174791,
      "p999": 21.174791,
      "stddev": 4.061101381329072,
      "m15_rate": 0.19780232116334415,
      "m1_rate": 0.17175127368841633,
      "m5_rate": 0.1935515941358193,
      "mean_rate": 0.09992547412748008,
      "duration_units": "milliseconds",
      "rate_units": "calls/second",
      "total": 34.135833,
      "_type": "timer"
    },
    {
      "_id": "jvm.memory-usage.heap.committed",
      "value": 2147483648,
      "_type": "gauge"
    },
    {
      "_id": "jvm.memory-usage.pools.Metaspace.committed",
      "value": 110043136,
      "_type": "gauge"
    },
    {
      "_id": "jvm.memory-usage.pools.CodeHeap-'non-profiled-nmethods'.committed",
      "value": 10813440,
      "_type": "gauge"
    },
    {
      "_id": "jvm.used-memory",
      "value": 2147483648,
      "_type": "gauge"
    },
    {
      "_id": "scheduler.job-store.repo.query-list.triggers",
      "count": 5,
      "max": 21.151916999999997,
      "mean": 15.297513466089498,
      "min": 8.745917,
      "p50": 15.716375,
      "p75": 16.422957999999998,
      "p95": 21.151916999999997,
      "p98": 21.151916999999997,
      "p99": 21.151916999999997,
      "p999": 21.151916999999997,
      "stddev": 3.80884629646711,
      "m15_rate": 0.39669429076432344,
      "m1_rate": 0.355760156614281,
      "m5_rate": 0.3902458849001428,
      "mean_rate": 0.2410821468791895,
      "duration_units": "milliseconds",
      "rate_units": "calls/second",
      "total": 76.092959,
      "_type": "timer"
    },
    {
      "_id": "jvm.memory-usage.pools.CodeHeap-'non-nmethods'.committed",
      "value": 2555904,
      "_type": "gauge"
    },
    {
      "_id": "jvm.memory-usage.total.init",
      "value": 2155151360,
      "_type": "gauge"
    },
    {
      "_id": "jvm.memory-usage.pools.CodeHeap-'non-nmethods'.used",
      "value": 2432384,
      "_type": "gauge"
    },
    {
      "_id": "jvm.memory-usage.non-heap.committed",
      "value": 171778048,
      "_type": "gauge"
    },
    {
      "_id": "jvm.memory-usage.pools.G1-Survivor-Space.usage",
      "value": 1,
      "_type": "gauge"
    },
    {
      "_id": "jvm.memory-usage.pools.G1-Eden-Space.init",
      "value": 113246208,
      "_type": "gauge"
    },
    {
      "_id": "jvm.memory-usage.pools.Metaspace.usage",
      "value": 0.9206230255320343,
      "_type": "gauge"
    },
    {
      "_id": "jvm.memory-usage.pools.G1-Eden-Space.max",
      "value": -1,
      "_type": "gauge"
    },
    {
      "_id": "jvm.memory-usage.pools.G1-Old-Gen.max",
      "value": 2147483648,
      "_type": "gauge"
    },
    {
      "_id": "jvm.memory-usage.total.used",
      "value": 1520570400,
      "_type": "gauge"
    },
    {
      "_id": "jvm.thread-state.blocked.count",
      "value": 0,
      "_type": "gauge"
    },
    {
      "_id": "jvm.memory-usage.pools.G1-Survivor-Space.used-after-gc",
      "value": 52428800,
      "_type": "gauge"
    },
    {
      "_id": "jvm.memory-usage.pools.G1-Eden-Space.usage",
      "value": 0.8114423851732474,
      "_type": "gauge"
    },
    {
      "_id": "jvm.memory-usage.pools.CodeHeap-'non-profiled-nmethods'.used",
      "value": 10729600,
      "_type": "gauge"
    },
    {
      "_id": "jvm.memory-usage.pools.CodeHeap-'profiled-nmethods'.used",
      "value": 33729792,
      "_type": "gauge"
    },
    {
      "_id": "repo.ds.query._adhoc-filter.scheduler",
      "count": 5,
      "max": 9.139959,
      "mean": 7.781217638351263,
      "min": 6.122667,
      "p50": 7.9247499999999995,
      "p75": 8.001249999999999,
      "p95": 9.139959,
      "p98": 9.139959,
      "p99": 9.139959,
      "p999": 9.139959,
      "stddev": 0.9531334102258491,
      "m15_rate": 0.39669429076432344,
      "m1_rate": 0.355760156614281,
      "m5_rate": 0.3902458849001428,
      "mean_rate": 0.2411032736278605,
      "duration_units": "milliseconds",
      "rate_units": "calls/second",
      "total": 38.649876,
      "_type": "timer"
    },
    {
      "_id": "jvm.memory-usage.pools.G1-Survivor-Space.init",
      "value": 0,
      "_type": "gauge"
    },
    {
      "_id": "jvm.memory-usage.non-heap.max",
      "value": -1,
      "_type": "gauge"
    },
    {
      "_id": "jvm.memory-usage.pools.G1-Survivor-Space.max",
      "value": -1,
      "_type": "gauge"
    },
    {
      "_id": "jvm.memory-usage.pools.G1-Survivor-Space.used",
      "value": 52428800,
      "_type": "gauge"
    },
    {
      "_id": "jvm.memory-usage.pools.CodeHeap-'profiled-nmethods'.max",
      "value": 122908672,
      "_type": "gauge"
    },
    {
      "_id": "jvm.thread-state.daemon.count",
      "value": 98,
      "_type": "gauge"
    },
    {
      "_id": "jvm.memory-usage.pools.G1-Eden-Space.used-after-gc",
      "value": 0,
      "_type": "gauge"
    },
    {
      "_id": "jvm.thread-state.new.count",
      "value": 0,
      "_type": "gauge"
    },
    {
      "_id": "repo.ds.query._adhoc-filter.cluster",
      "count": 10,
      "max": 7.115333,
      "mean": 4.415241990632845,
      "min": 2.32275,
      "p50": 4.271917,
      "p75": 5.5420419999999995,
      "p95": 7.115333,
      "p98": 7.115333,
      "p99": 7.115333,
      "p999": 7.115333,
      "stddev": 1.57203480094502,
      "m15_rate": 0.5967004294211492,
      "m1_rate": 0.5570387357406746,
      "m5_rate": 0.590300523467897,
      "mean_rate": 0.4695941183571473,
      "duration_units": "milliseconds",
      "rate_units": "calls/second",
      "total": 43.476667,
      "_type": "timer"
    },
    {
      "_id": "jvm.memory-usage.pools.G1-Eden-Space.used",
      "value": 317718528,
      "_type": "gauge"
    },
    {
      "_id": "jvm.memory-usage.pools.Compressed-Class-Space.committed",
      "value": 14024704,
      "_type": "gauge"
    },
    {
      "_id": "jvm.garbage-collector.G1-Young-Generation.time",
      "value": 465,
      "_type": "gauge"
    },
    {
      "_id": "jvm.memory-usage.pools.CodeHeap-'non-nmethods'.init",
      "value": 2555904,
      "_type": "gauge"
    },
    {
      "_id": "jvm.thread-state.count",
      "value": 180,
      "_type": "gauge"
    },
    {
      "_id": "jvm.memory-usage.pools.CodeHeap-'non-profiled-nmethods'.max",
      "value": 122912768,
      "_type": "gauge"
    },
    {
      "_id": "jvm.memory-usage.non-heap.init",
      "value": 7667712,
      "_type": "gauge"
    },
    {
      "_id": "audit.authentication",
      "m15_rate": 0.19780232116334415,
      "m1_rate": 0.17175127368841633,
      "m5_rate": 0.1935515941358193,
      "mean_rate": 0.09988653077391328,
      "units": "events/second",
      "total": 2,
      "count": 2,
      "_type": "summary"
    },
    {
      "_id": "jvm.memory-usage.heap.used",
      "value": 507426664,
      "_type": "gauge"
    },
    {
      "_id": "jvm.class-loading.unloaded",
      "value": 16,
      "_type": "gauge"
    },
    {
      "_id": "jvm.thread-state.runnable.count",
      "value": 46,
      "_type": "gauge"
    },
    {
      "_id": "audit.access",
      "m15_rate": 0.19779007785878447,
      "m1_rate": 0.16929634497812282,
      "m5_rate": 0.1934432200964012,
      "mean_rate": 0.05002186361867778,
      "units": "events/second",
      "total": 1,
      "count": 1,
      "_type": "summary"
    },
    {
      "_id": "jvm.memory-usage.pools.CodeHeap-'profiled-nmethods'.committed",
      "value": 34340864,
      "_type": "gauge"
    },
    {
      "_id": "jvm.memory-usage.pools.G1-Eden-Space.committed",
      "value": 1300234240,
      "_type": "gauge"
    },
    {
      "_id": "jvm.memory-usage.pools.Metaspace.max",
      "value": -1,
      "_type": "gauge"
    },
    {
      "_id": "jvm.memory-usage.pools.G1-Old-Gen.used-after-gc",
      "value": 121026408,
      "_type": "gauge"
    },
    {
      "_id": "jvm.memory-usage.pools.Compressed-Class-Space.max",
      "value": 1073741824,
      "_type": "gauge"
    },
    {
      "_id": "jvm.memory-usage.heap.max",
      "value": 2147483648,
      "_type": "gauge"
    },
    {
      "_id": "jvm.memory-usage.pools.CodeHeap-'non-nmethods'.max",
      "value": 5836800,
      "_type": "gauge"
    },
    {
      "_id": "jvm.memory-usage.pools.CodeHeap-'profiled-nmethods'.usage",
      "value": 0.39190126470490216,
      "_type": "gauge"
    },
    {
      "_id": "jvm.memory-usage.pools.Compressed-Class-Space.used",
      "value": 11149728,
      "_type": "gauge"
    },
    {
      "_id": "jvm.free-used-memory",
      "value": 860110576,
      "_type": "gauge"
    }
  ],
  "resultCount": 85,
  "pagedResultsCookie": null,
  "totalPagedResultsPolicy": "EXACT",
  "totalPagedResults": 85,
  "remainingPagedResults": -1
}| Metrics are only collected after they have been triggered by activity in IDM, such as a reconciliation. |
Learn more:
Dropwizard widget
The Dropwizard widget creates a graph of metrics based on server activity and is useful for lightweight, live monitoring of IDM. The widget has the following limitations:
-
The graph created by the widget does not persist. If you reload or navigate away from the page, the graph restarts.
-
The widget only works with time-based metrics.
To add the Dropwizard widget:
-
From the navigation bar, click Dashboards > Dashboard Name.
-
On the Dashboard Name page, click Add Widget.
-
In the Add Widget window, from the Select a Widget drop-down list, select Dropwizard Table with Graph.
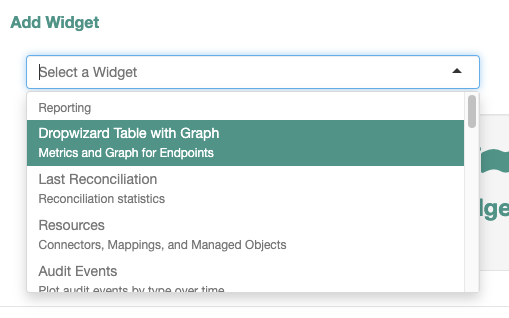
-
To preview any metric on the graph, click Add to Graph adjacent to any metric.
-
Click Add.
The Dropwizard widget now displays on the dashboard.
Prometheus endpoint
This topic describes how to configure Prometheus and Grafana to collect IDM metrics. These third-party tools are not supported by ForgeRock. Refer to the Prometheus documentation.
Prometheus is a third-party tool used for gathering and processing monitoring data. Prometheus uses the openidm/metrics/prometheus endpoint to gather information. This endpoint is protected by a basic authentication filter, using the following credentials, set in the resolver/boot.properties file:
openidm.prometheus.username=username
openidm.prometheus.password=password|
The Prometheus endpoint also supports secret resolution. Refer to Secret stores. |
Disable Prometheus
To disable IDM’s Prometheus handler, comment out or remove openidm.prometheus.username and openidm.prometheus.password from the resolver/boot.properties file. If these properties are not set, IDM does not enable the Prometheus handler.
Configure Prometheus
-
Download Prometheus.
-
Create a
prometheus.ymlconfiguration file. For more information, refer to the Prometheus configuration documentation. An exampleprometheus.ymlfile:global: scrape_interval: 15s external_labels: monitor: 'my_prometheus' # https://prometheus.io/docs/operating/configuration/#scrape_config scrape_configs: - job_name: 'openidm' scrape_interval: 15s scrape_timeout: 5s metrics_path: 'openidm/metrics/prometheus' scheme: http basic_auth: username: 'prometheus' password: 'prometheus' static_configs: - targets: ['localhost:8080']This example configures Prometheus to poll the
openidm/metrics/prometheusendpoint every 5 seconds (scrape_interval: 5s), receiving metrics in a plain text format (_fields: ['text']and_mimeType: ['text/plain;version=0.0.4']). For more information about reporting formats, refer to the Prometheus documentation on Exposition Formats. -
Verify the configuration returns metric results:
Requestcurl \ --user prometheus:prometheus \ --header "Accept-API-Version: resource=1.0" \ --request GET \ 'http://localhost:8080/openidm/metrics/prometheus'Show example response
Response# HELP idm_jvm_available_cpus Automatically generated # TYPE idm_jvm_available_cpus gauge idm_jvm_available_cpus 10.0 # HELP idm_jvm_class_loading_loaded Automatically generated # TYPE idm_jvm_class_loading_loaded gauge idm_jvm_class_loading_loaded 24876.0 # HELP idm_jvm_class_loading_unloaded Automatically generated # TYPE idm_jvm_class_loading_unloaded gauge idm_jvm_class_loading_unloaded 1.0 # HELP idm_jvm_free_used_memory_bytes Automatically generated # TYPE idm_jvm_free_used_memory_bytes gauge idm_jvm_free_used_memory_bytes 9.77543264E8 # HELP idm_jvm_garbage_collector_g1_old_generation_count Automatically generated # TYPE idm_jvm_garbage_collector_g1_old_generation_count gauge idm_jvm_garbage_collector_g1_old_generation_count 0.0 # HELP idm_jvm_garbage_collector_g1_old_generation_time Automatically generated # TYPE idm_jvm_garbage_collector_g1_old_generation_time gauge idm_jvm_garbage_collector_g1_old_generation_time 0.0 # HELP idm_jvm_garbage_collector_g1_young_generation_count Automatically generated # TYPE idm_jvm_garbage_collector_g1_young_generation_count gauge idm_jvm_garbage_collector_g1_young_generation_count 82.0 # HELP idm_jvm_garbage_collector_g1_young_generation_time Automatically generated # TYPE idm_jvm_garbage_collector_g1_young_generation_time gauge idm_jvm_garbage_collector_g1_young_generation_time 2127.0 # HELP idm_jvm_max_memory_bytes Automatically generated # TYPE idm_jvm_max_memory_bytes gauge idm_jvm_max_memory_bytes 2.147483648E9 ... -
Start Prometheus with the
prometheus.ymlconfiguration file:prometheus --config.file=/path/to/prometheus.yml -
To confirm that Prometheus is gathering data from IDM, go to the Prometheus monitoring page (default
http://localhost:9090).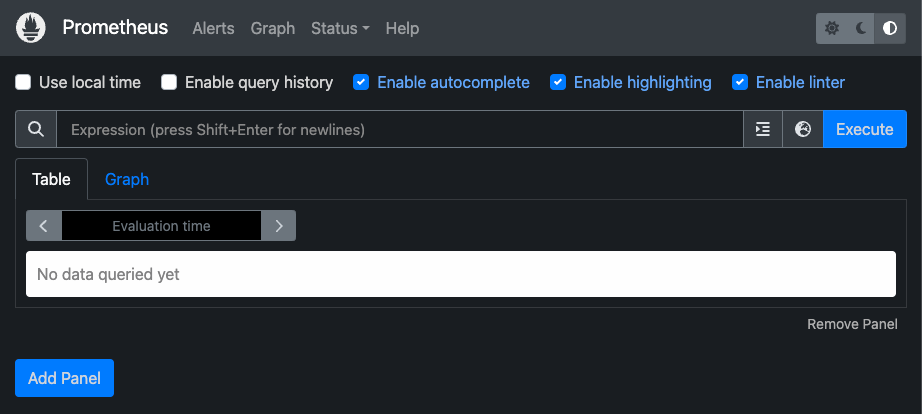
Configure Grafana
Prometheus lets you monitor and process information provided by IDM. If you need deeper analytics, you can use tools such as Grafana to create customized charts and graphs based on Prometheus data. For information on installing and running Grafana, refer to the Grafana website.
You can also monitor aspects of IDM’s performance using Prometheus to plug JVM metrics into a Grafana dashboard. For more information on using metrics to observe the system under load, refer to Load testing.
Before you get started, download the Monitoring Dashboard Samples from the ForgeRock BackStage download site. Open monitoring.dashboard.json from the downloaded .zip file, as you’ll need it during the following procedure.
|
To set up a Grafana dashboard with IDM metrics using Prometheus:
-
In a browser, go to the main Grafana page (default
http://localhost:3000) and log in.The default username and password for Grafana is admin. -
To add your Prometheus installation to Grafana as a data source, click the toggle menu button
 , and click Connections > Data sources.
 -
On the Data sources page, click Add data source.
-
On the Add data source page, select Prometheus.
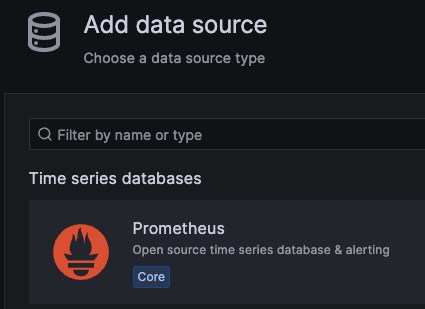
-
Enter information and select options, as needed. The information you enter here should match the settings in the
monitoring.dashboard.jsonfile:-
Give your data source a name; for example,
ForgeRockIDM. -
Set the URL (default
http://localhost:9090). -
Enable Basic auth.
-
Enter the User (default
prometheus). -
Enter the Password (default
prometheus).
-
-
-
Click Save & test.
If the test succeeds, Grafana displays Data source is working.
Create a Grafana dashboard
After Prometheus has been configured as a data source in Grafana, you can create a dashboard with IDM metrics:
-
In Grafana, click the toggle menu button
, and click Dashboards. -
Click New, and do one of the following:
-
Select Import.
-
On the Import dashboard page, drag the
monitoring.dashboard.jsonfile from its location on your system to the Upload dashboard JSON file area. -
Enter information in the Options area, and select the Prometheus data source you previously created.
-
Click Import.
-
-
Select New dashboard.
-
Click Add visualization.
-
Select the Prometheus data source you previously created.
-
Configure the panel.
For more information, refer to:
-
-