JMX monitoring
You can configure AM to let you listen for Java Management eXtension (JMX) clients, by default on port 9999.
Either use the AM console page under Configure > Global Services > Monitoring
and make sure both Monitoring Status and Monitoring RMI interface status are enabled,
or use the ssoadm command:
$ ssoadm \
set-attr-defs \
--servicename iPlanetAMMonitoringService \
--schematype Global \
--adminid uid=amAdmin,ou=People,dc=openam,dc=forgerock,dc=org \
--password-file /tmp/pwd.txt \
--attributevalues iplanet-am-monitoring-enabled=true \
iplanet-am-monitoring-rmi-enabled=true
A number of tools support JMX, including jvisualvm and jconsole.
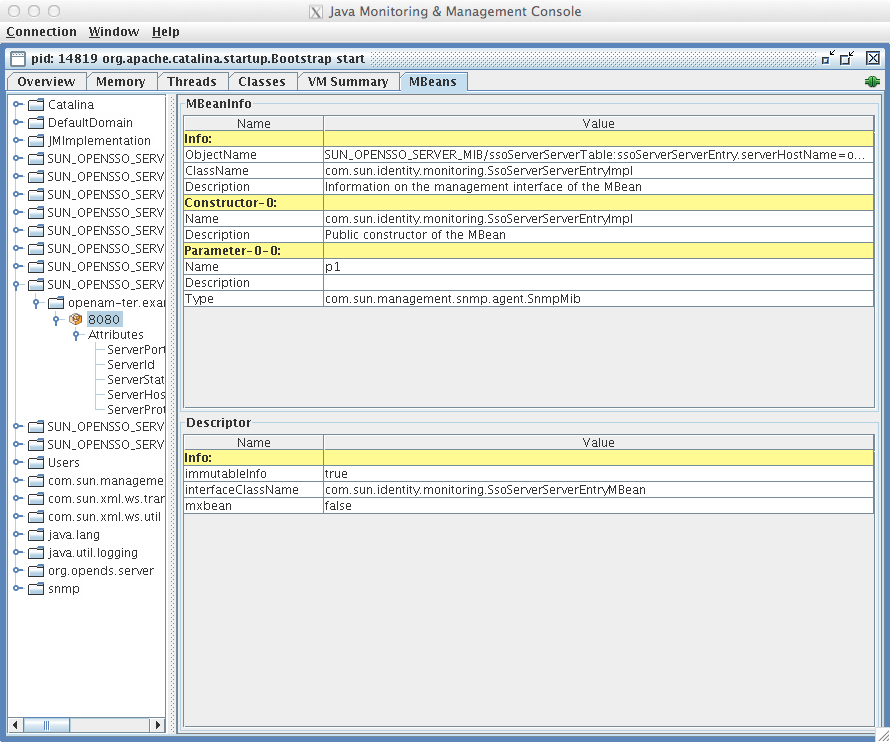
When you use jconsole to browse AM MBeans for example,
the default URL for the AM running on the local system is service:jmx:rmi:///jndi/rmi://localhost:9999/server.
$ jconsole service:jmx:rmi:///jndi/rmi://localhost:9999/server &To browse MBeans, connect to your web application container, and go to the AM MBeans. By default, JMX monitoring for the container is likely to be accessible only locally, using the process ID.
Also see Monitoring and Management Using JMX for instructions on how to connect remotely, how to use SSL, and so on.
|
JMX has a limitation in that some Operations and CTS tables cannot be properly serialized from AM to JMX. As a result, only a portion of AM’s monitoring information is available through JMX. ForgeRock recommends using Prometheus, Graphite, or Common REST monitoring. |
For monitoring metrics reference, see Monitoring metrics.