Manage dashboards
Dashboards let you make shortcuts to frequently-required tasks. The Quick Start dashboard displays by default when you log in to the admin UI. You can create additional dashboards, or add and remove widgets from the existing dashboards.
Default dashboards
To display all configured dashboards, select Dashboards > Manage Dashboards. The following dashboards are provided by default.
Quick start dashboard
Quick Start cards support one-click access to common administrative tasks:
Add Connector
Configure connections to external resources.
Create Mapping
Configure mappings to synchronize objects between resources.
Manage Roles
Set up provisioning or authorization roles.
Add Device
Configure managed objects, including users, groups, roles, and devices.
Configure Registration
Configure user self-registration.
Configure Password Reset
Configure user self-service password reset.
Manage Users
Manage users in the repository.
Configure System Preferences
Configure server settings for Audit, Workflow, and more.
System monitoring dashboard
The System Monitoring Dashboard includes information about:
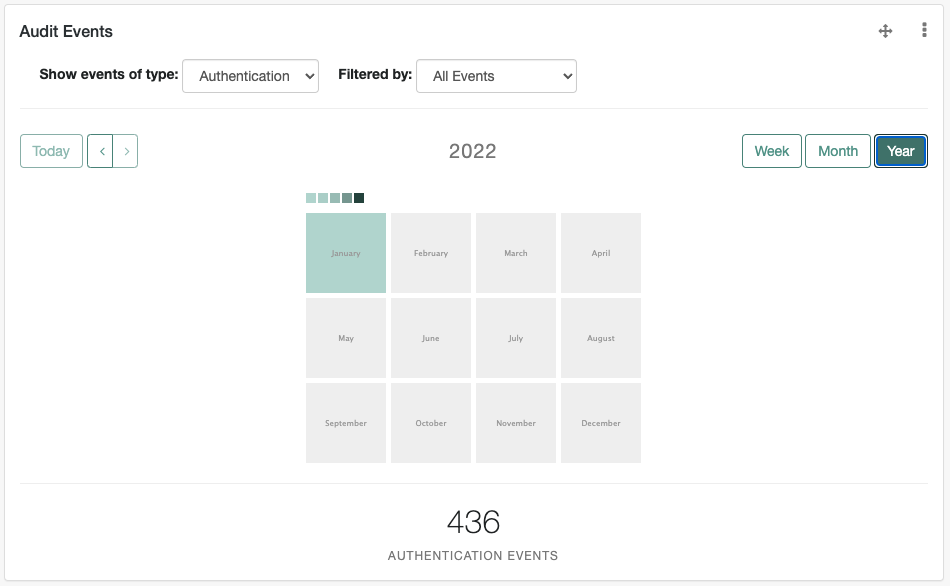
Audit Events
Includes information on audit data, organized by date.
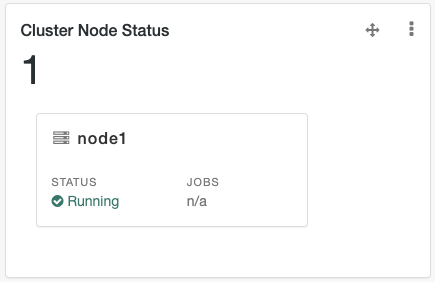
Cluster Node Status
Includes information on cluster nodes.
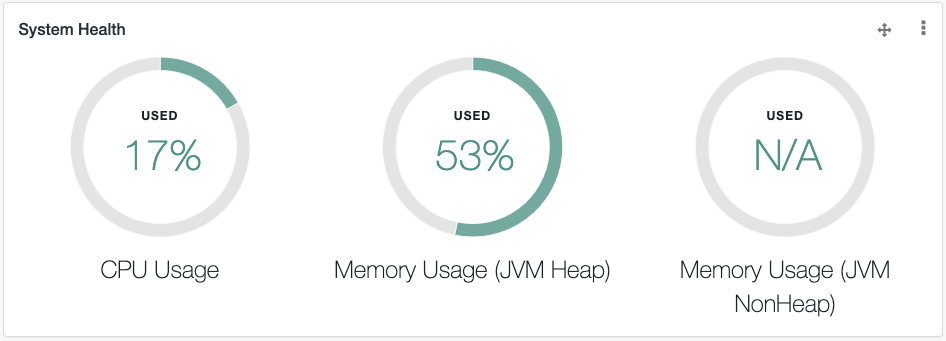
System Health
Includes information on system resource usage.
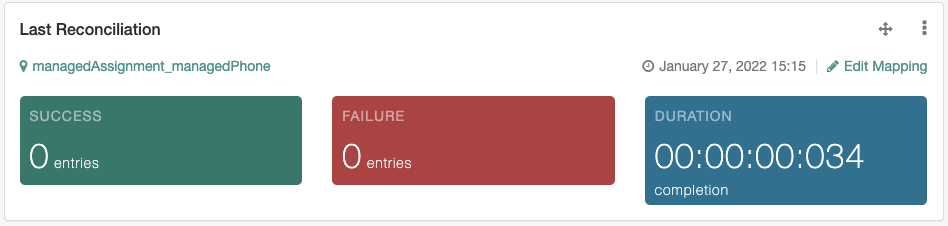
Last Reconciliation
Includes data from the most recent data reconciliation.
Custom dashboards
You can set up additional dashboards for customized views of the admin UI.
Create a new dashboard
To create a new dashboard, select Dashboards > New Dashboard. Enter a dashboard name and select whether this dashboard should be the default board that is displayed when you load the admin UI.
For a customized view of the admin UI, select Widgets as the Dashboard Type, click Create Dashboard, and add the widgets that you want exposed in that view.
You can also customize the view by starting with an existing dashboard. In the upper-right corner of the UI, next to the Add Widget button, click the overflow menu > widget, and select Rename or Duplicate.
Add and move widgets
To add a widget to a dashboard, click Add Widget and select the widget type. Widgets are grouped in categories. Scroll down to the category of the widget you want to add.
To change the position of a widget on a dashboard, click and drag the move button .
To add a new Quick Start widget, select the overflow menu > widget in the upper right corner of the widget, and click Settings.
To embed an admin UI sub-widget in the Quick Start widget, specify the destination URL. If you are linking to a specific page in the admin UI, the destination URL can be the part of admin UI address. For example, to create a quick start link to the Audit Configuration tab, at {secureHostname}/admin/#settings/audit/, enter #settings/audit in the destination URL text box.
Any changes to the dashboards are persisted in your project’s conf/ui-dashboard.json file, which has the following properties:
| Property | Values | Description |
|---|---|---|
|
String |
Dashboard name. |
|
|
Default dashboard. You can only set one default. |
|
Different attributes based on |
Attributes that define the widget. |
|
|
Widget type. |
|
|
Width of widget, based on a 12-column grid system, where x-small=4, small=6, medium=8, and large=12. For more information, refer to Bootstrap CSS. |
|
|
Reconciliation bar chart; applies only to the Last Reconciliation widget. |
Admin UI widgets
The following tables list the available widgets:
admin UI reporting widgets
| Name | Description |
|---|---|
Audit Events |
Graphical display of audit events. |
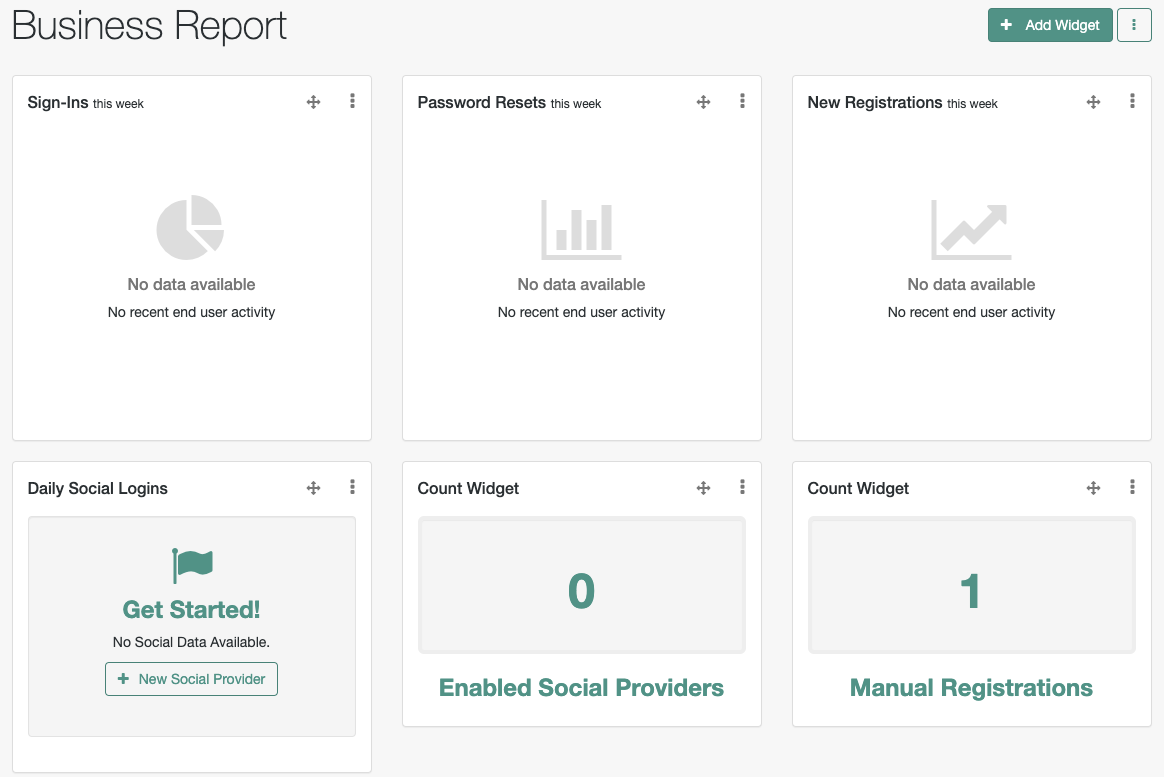
Count Widget |
A count widget that provides an instant display of the number of specific objects; for example, active managed users, and enabled social providers. |
Dropwizard Table With Graph |
Does not appear in the list of widgets unless metrics are active. |
Graph Widget |
Provides a graphical view of a specific managed resource; for example, managed users, based on some metric. |
Last Reconciliation |
Shows statistics from the most recent reconciliation, shown on the System Monitoring dashboard. |
New Registrations |
The number of users that have self-registered that week. To display data using this widget, you must enable user self-registration. |
Password Resets |
The number of password resets that week. To display data using this widget, you must enable password reset. |
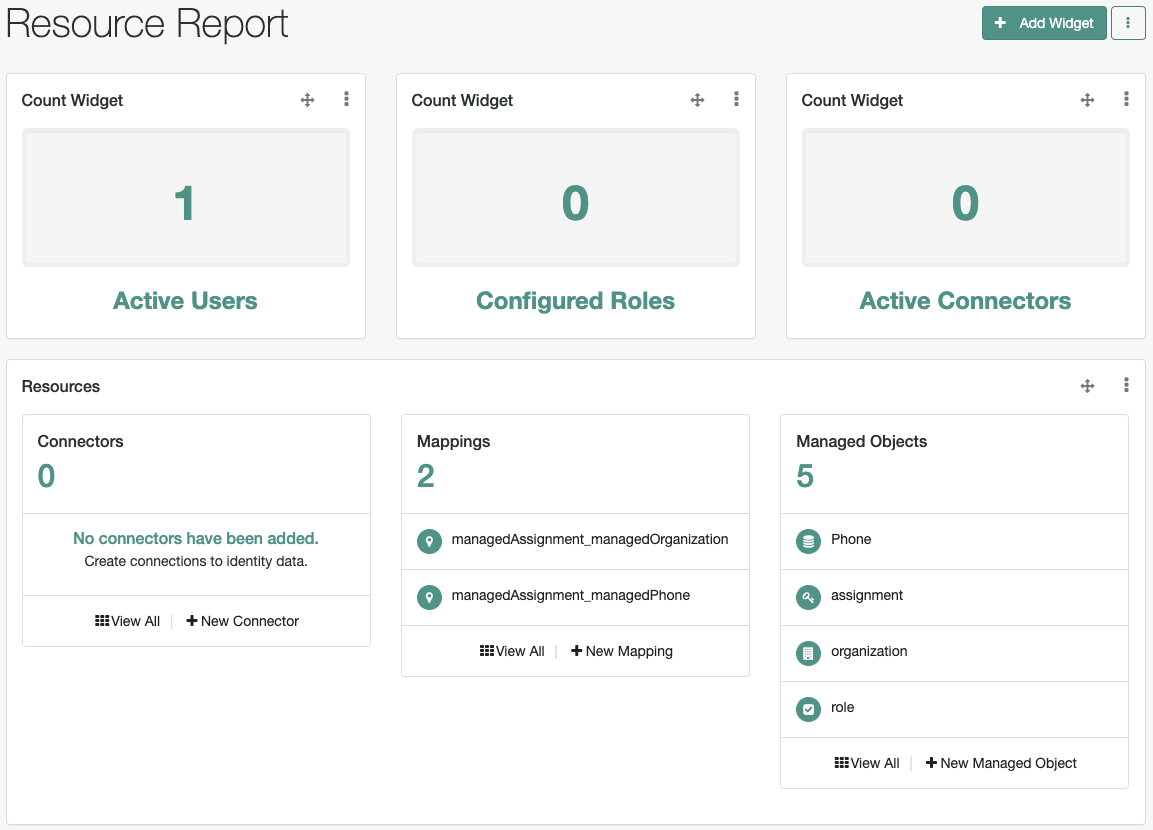
Resources |
Connectors, mappings, managed objects; shown in Administration dashboard. |
Sign-Ins |
The number of managed users that have signed in to the service that week. |
Social widgets
| Name | Description |
|---|---|
Daily Social Logins |
Graphical display of logins through social identity providers. |
Social Registration (year) |
Graphical display of social registrations over the past year. |
System status widgets
| Name | Description |
|---|---|
Cluster Node Status |
Lists the instances in a cluster, with their status. |
Utility widgets
| Name | Description |
|---|---|
Quick Start |
Links to common tasks; shown in the Administration dashboard. |
Identity Relationships |
Graphical display of relationships between identities. |
Managed Objects Relationship Diagram |
Graphical diagram with connections between managed object properties; also refer to View the Relationship Configuration in the UI. |