Monitor your tenant
PingOne Advanced Identity Cloud lets you monitor uptime status and system performance.
|
Advanced Identity Cloud also provides APIs for extracting log data. Learn more in View audit and debug logs. |
Monitor uptime status
Tenant status page
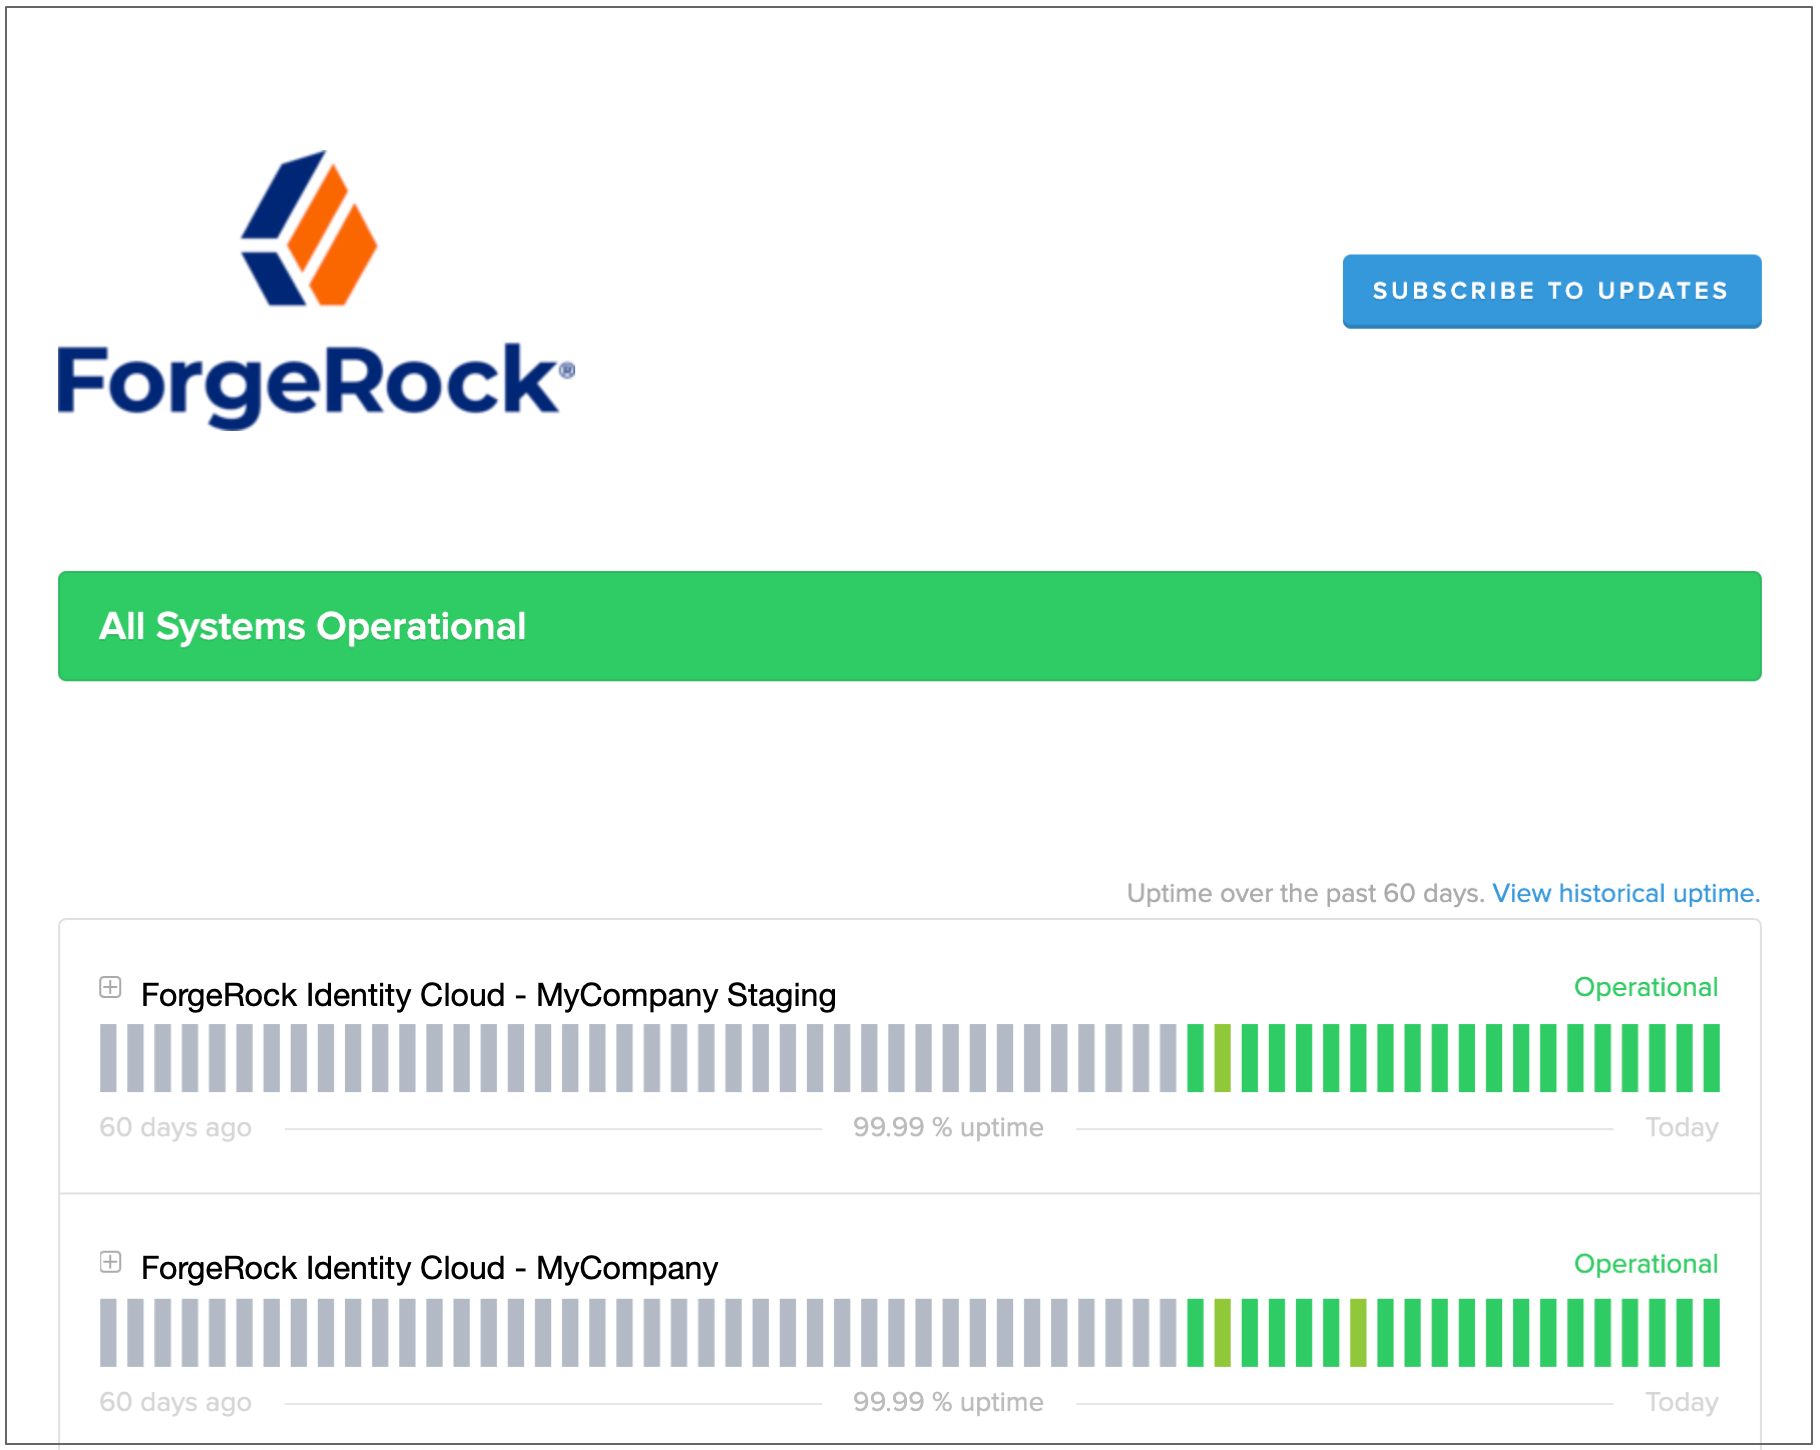
Use your tenant status page to monitor uptime and historical trends for your production environment.
| If you don’t have access to this page, follow the instructions in Get status page access credentials for additional tenant administrators. |
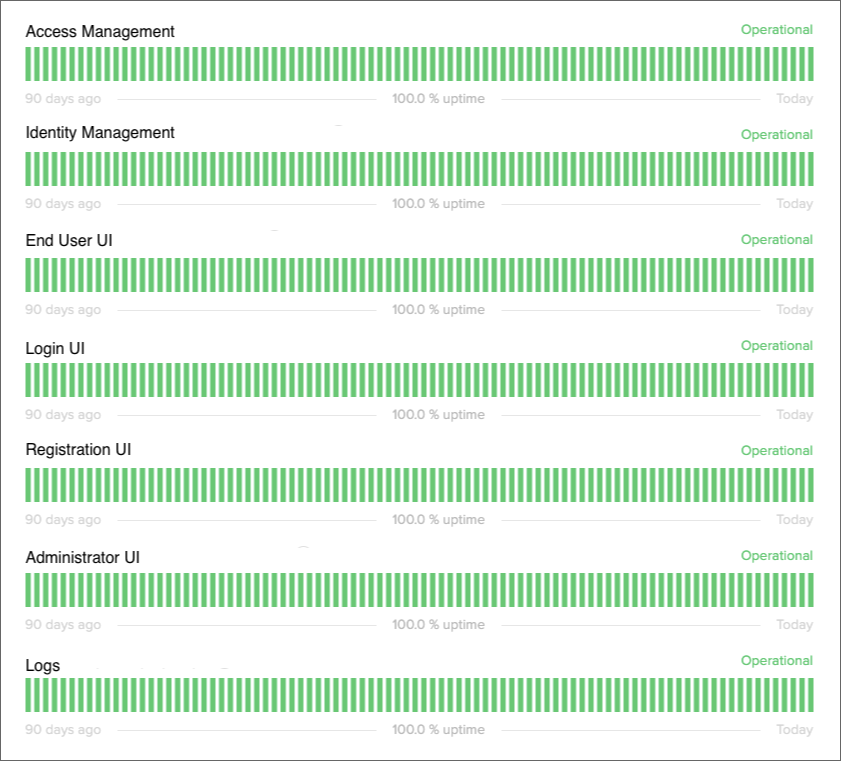
The tenant status page shows individual statuses for these services:
-
Access Management
-
Identity Management
-
Administrator UI
-
Logs
Manage access to your tenant status page
Get status page access credentials for the initial tenant administrator
If you are the initial tenant administrator, you should have received status page credentials when your tenant was set up.
If you have lost or forgotten those credentials, follow the instructions in Get status page access credentials for additional tenant administrators.
Get status page access credentials for additional tenant administrators
If monitoring Advanced Identity Cloud uptime status is part of a tenant administrator’s role, create a support case in the Ping Identity Support Portal to request that the administrator receive access to the tenant status page.
-
You can request access on behalf of one or more tenant administrators, including yourself.
-
In the request, provide the email address of each tenant administrator you want to have status page access.
Remove status page access for tenant administrators
If you want to remove status page access for one or more tenant administrators, create a support case in the Ping Identity Support Portal. In the request, provide the email address of each tenant administrator from which you want to remove access.
Access your tenant status page
| If you don’t have access to this page, follow the instructions in Get status page access credentials for additional tenant administrators. |
-
Identify your tenant domain name by removing the protocol and any trailing slash from your tenant FQDN.
Example:
openam-mycompany-mytenant-usw1.id.forgerock.io -
Obtain your tenant status page URL by appending your tenant domain name to the Advanced Identity Cloud status page URL, https://status.id.forgerock.io.
Example: https://status.id.forgerock.io/openam-mycompany-mytenant-usw1.id.forgerock.io
-
Open your tenant status page URL in a browser.
-
On the sign-on page, enter your status page credentials.
-
Click Authenticate.
Your tenant status page displays, showing real-time status information for your production tenant environment:
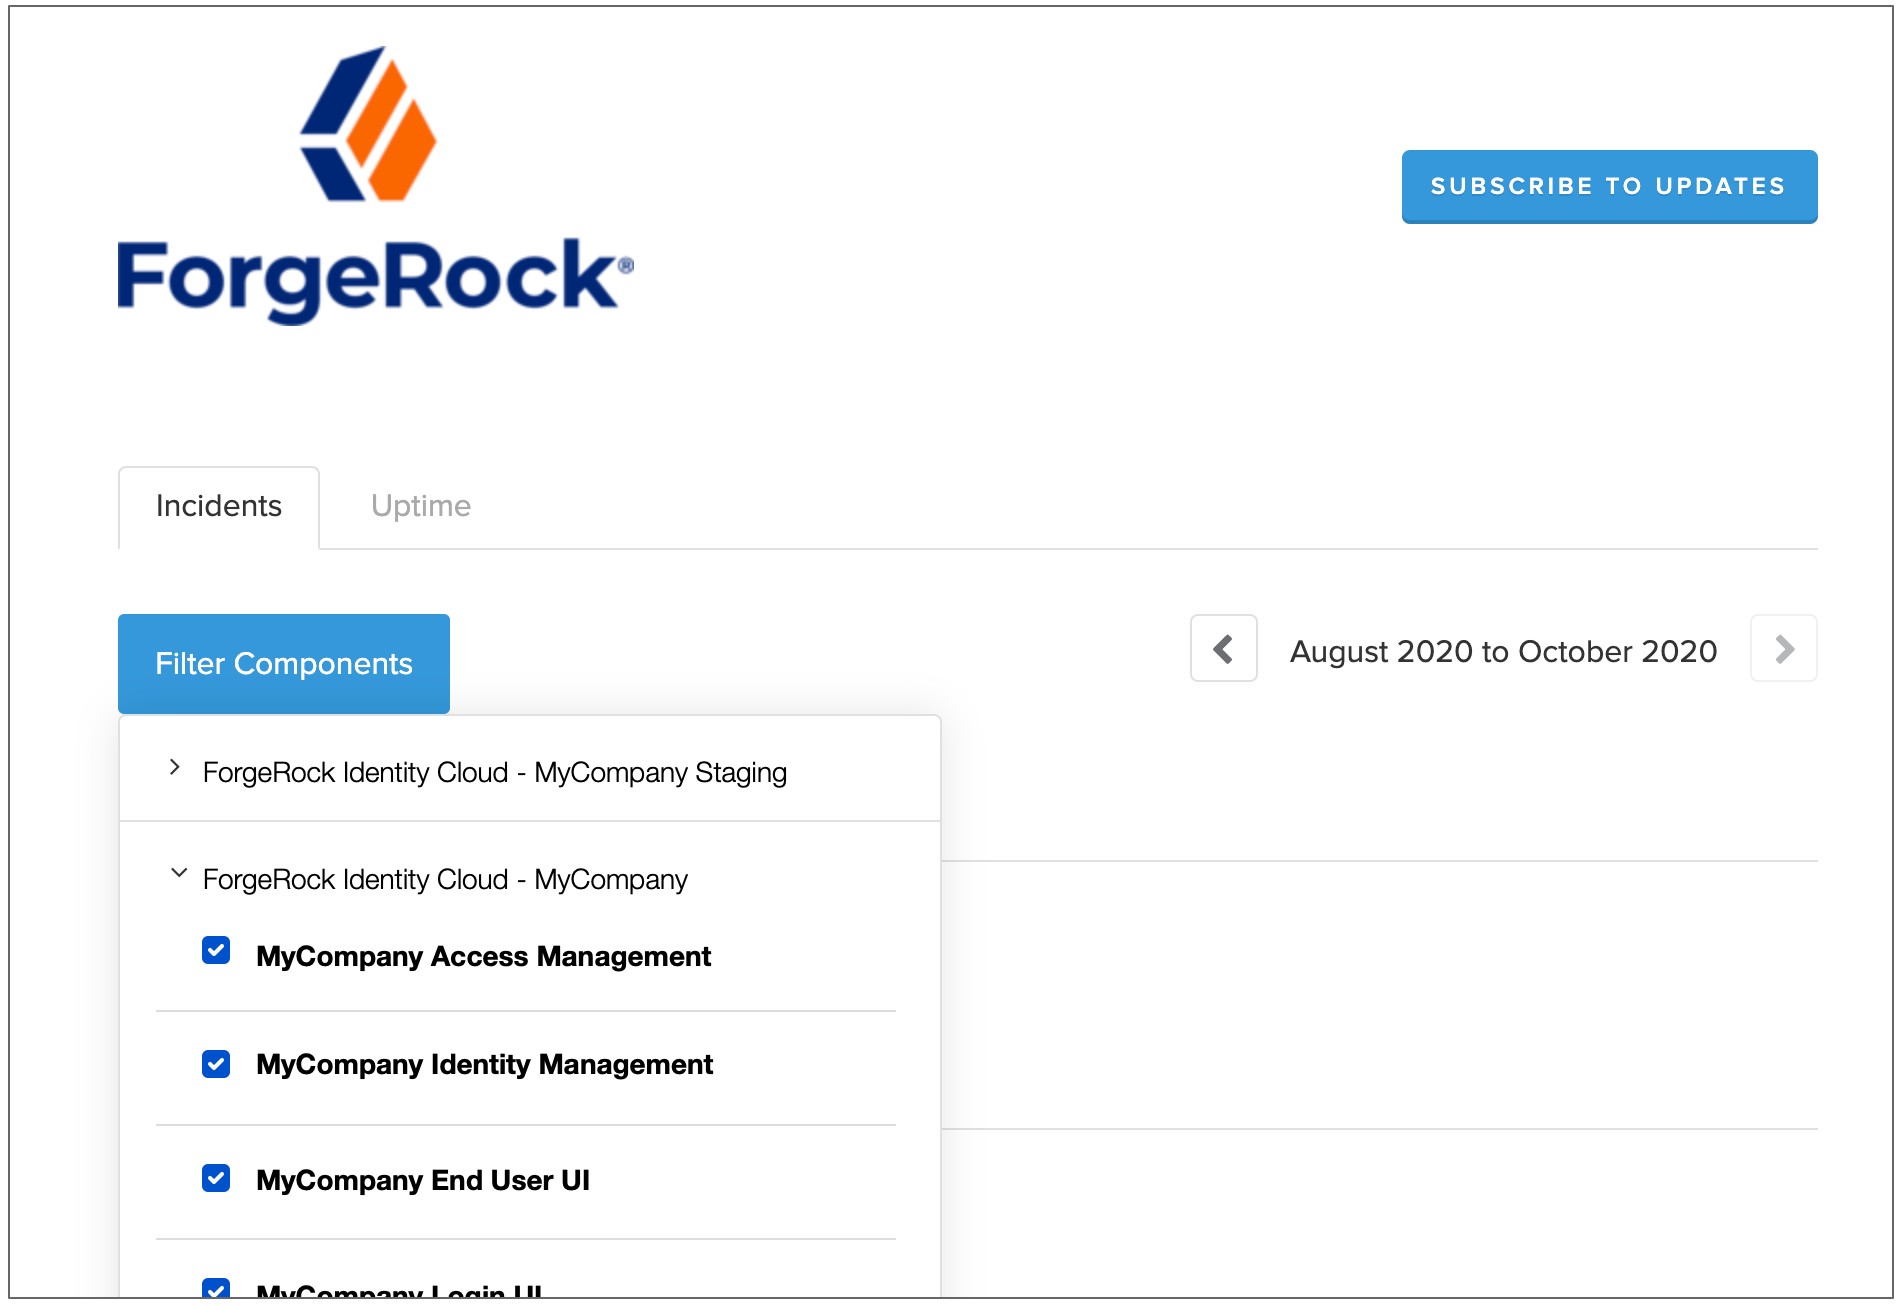
View incident reports in your production tenant environment
Filter your status page to show service incidents in your production tenant environment:
-
Click View historical uptime.
-
Select the Incidents tab.
-
For the production environment, click Filter Components, then select one or more Advanced Identity Cloud services.
-
Click Filter Components again to view the incident reports.
Monitor system performance
Monitor using health check endpoint
Use the HTTP response codes from the /monitoring/health endpoint to integrate your tenant
environment with external monitoring tools such as Pingdom.
$ curl 'https://<tenant-env-fqdn>/monitoring/health'This endpoint returns the following HTTP response status codes:
- 200
-
Indicates all critical services in an environment are healthy. This status code also shows the informational message
OK. - 503
-
Indicates one or more critical services in an environment are not healthy. This status code also shows the informational message
Service Unavailable.
Monitor using Prometheus endpoints
Advanced Identity Cloud provides monitoring endpoints you can use with Prometheus.
| Endpoint | Description | ||
|---|---|---|---|
|
Produces Prometheus-formatted metrics for Access Management. Learn which AM metrics are available in the self-managed documentation:
|
||
|
Produces Prometheus-formatted metrics for Identity Management Learn which IDM metrics are available in the self-managed documentation: |
|
Advanced Identity Cloud adds a |
You must obtain API credentials to authenticate to the /monitoring/prometheus/am and
/monitoring/prometheus/idm endpoints. Learn more in
Authenticate to Advanced Identity Cloud REST API with API key and secret.
You can download and run a Docker-based example of a Grafana dashboard. The demo requires that you have Docker Desktop installed, and requires macOS.
To try the demo:
-
Download and extract the PingOne Advanced Identity Cloud Monitoring Demo ZIP file.
-
Edit the
setup_monitoring_config.shfile:-
In the
TENANT_DOMAINvariable, enter the domain name of your tenant.Do not include the protocol, and do not add a trailing slash.
For example:
TENANT_DOMAIN="openam-mycompany-mytenant-usw1.id.forgerock.io"bash -
In the
API_KEY_IDandAPI_KEY_SECRETvariables, enter the API credentials you obtained earlier.For example:
API_KEY_ID="b977d5724ef...562e4c57"
API_KEY_SECRET="d3628be865ce152f49...870e5fd3506c4"
bash -
Save your changes.
-
-
Run the
setup_monitoring_config.shscript.The Shell script will set up the following config files:
Config File Description prometheus/prometheus.ymlThe script populates the tenant domain and API credentials.
docker/docker-compose.ymlThe script populates the working directory path.
-
Run the following Docker command:
docker-compose -f docker/docker-compose.yml up
The command downloads a Prometheus Docker image and configures it for your tenant. It also downloads a Grafana Docker image, and configures it to use the Prometheus image as a data source.
-
When the command output for the "grafana_1" container displays a message that contains "HTTP Server Listen", open http://localhost:3000 in a web browser.
-
Log in with username
admin, passwordadmin. -
Enter a new password to use for the administrator, or click Skip.
-
On the Grafana Home page, select Dashboards in the left-side hamburger menu.
The Dashboards page appears.
-
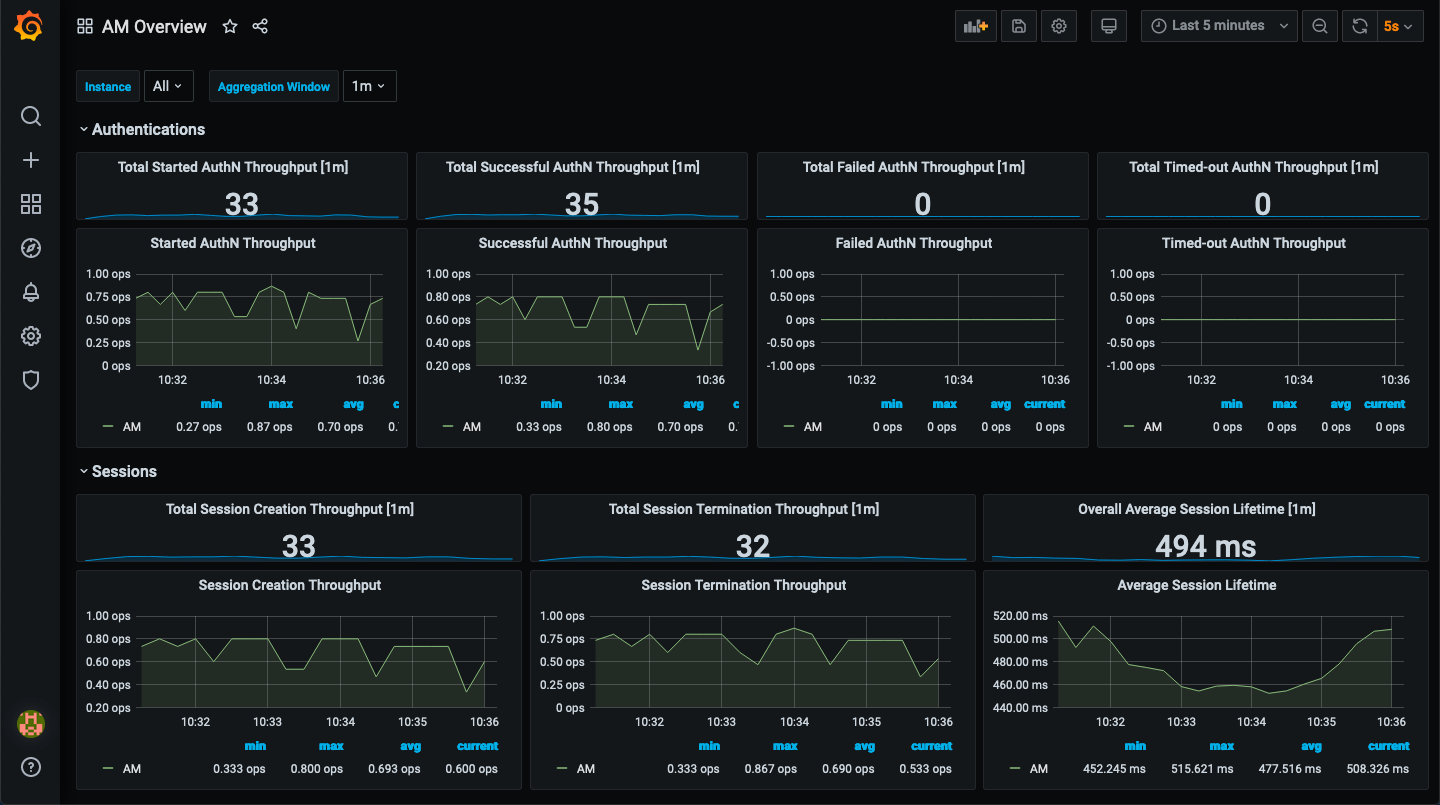
Select AM Overview to view the AM overview dashboard:
-
Select IDM Sample Dashboard to view the IDM sample dashboard.
-
Go to http://localhost:9090 to view the Prometheus dashboard.