Use dashboards to detect risks
|
End of life for Autonomous Access After much consideration and extensive evaluation of our product portfolio, Ping Identity is discontinuing support for the Advanced Identity Cloud Autonomous Access product, effective October 31, 2024. To support our Autonomous Access customers, we’re offering migration assistance to PingOne Protect, an advanced threat detection solution that leverages machine learning to analyze authentication signals and detect abnormal online behavior. PingOne Protect is a well-established product, trusted by hundreds of customers worldwide. The end of life for Autonomous Access indicates the following:
For any questions, please contact Ping Identity Support for assistance. |
Autonomous Access provides a simple and intuitive graphical UI displaying the risks detected across your organization. The dashboard displays the risky events specific to the realm that you are in.
This section provides an overview of the available Autonomous Access UIs with your deployment.
Access the Risk dashboard
On the Risk dashboard, Autonomous Access displays a global map featuring sortable list of "anomalous" or risky events discovered during the AI/ML analytics run.
To access the Risk dashboard, from the left navigation pane of the Advanced Identity Cloud admin UI, click Dashboard > Risk.
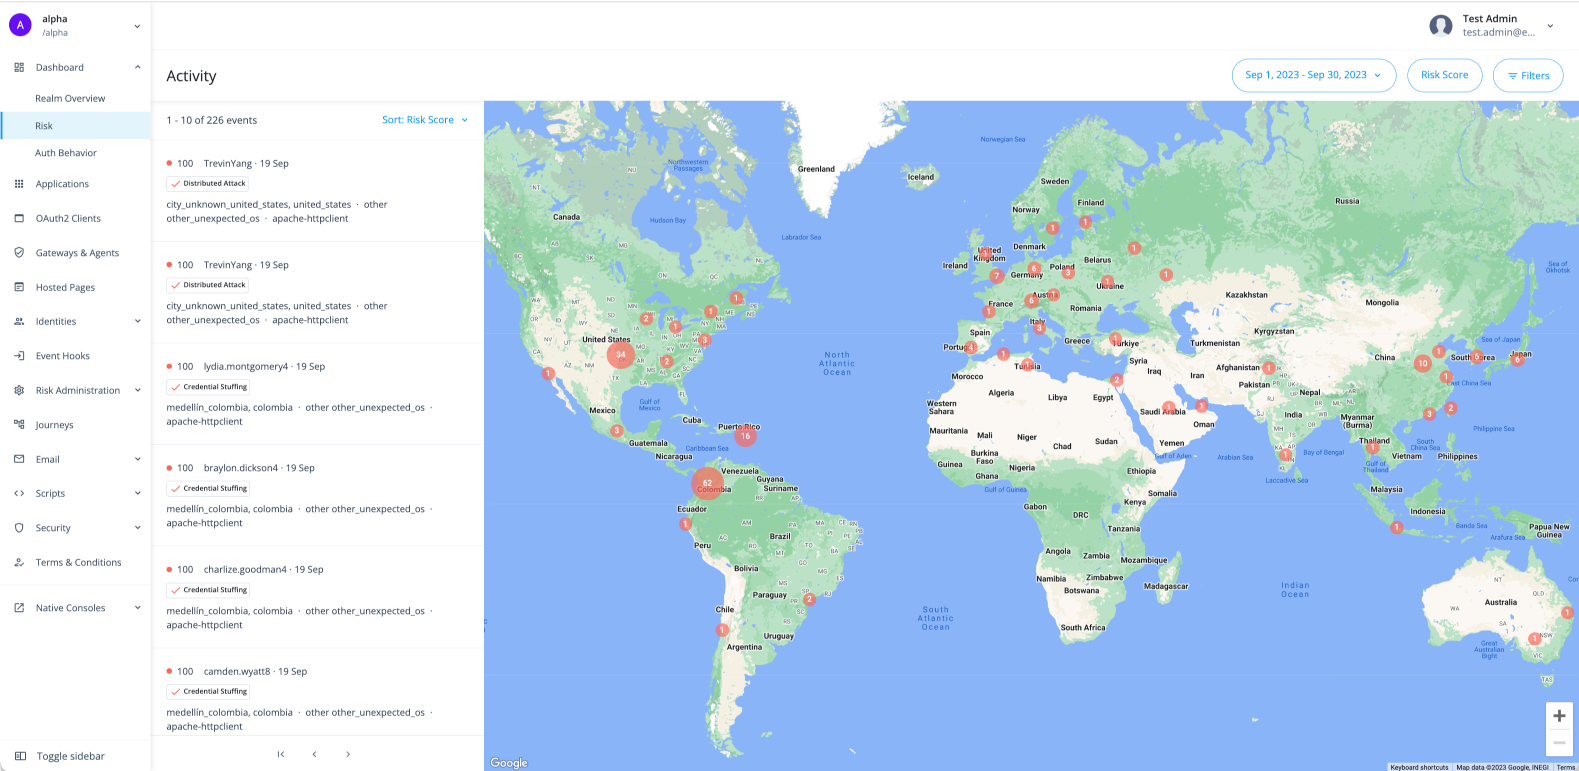
Each event displays a summary of the event with the following information:
| Data Element | Description |
|---|---|
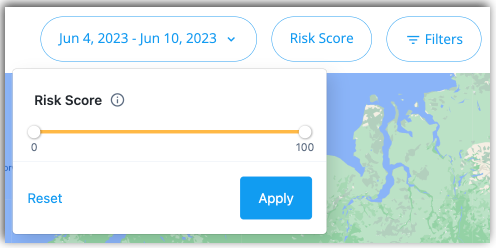
Risk Score |
Risk score associated with the event. A risk score is a combination of the likelihood an anomalous behavior event and/or a known threat is detected. Therefore, a risk score of 100 indicates the highest likelihood an access attempt was an anomaly and/or a known threat, such as suspicious IP, credential stuffing, or others. |
User Identifier |
Username on the account. |
Date of Occurrence |
Date the anomalous event occurred. |
Heuristics |
Type of heuristic used in the AI/ML analytics. The heuristic indicates the type of risk threat. These include:
|
City, Country |
Geolocation information for city and country. |
Browser Type |
Browser type can include:
|
|
You can sort the activity events list by clicking Sort: Risk Score and selecting one of the following:
|
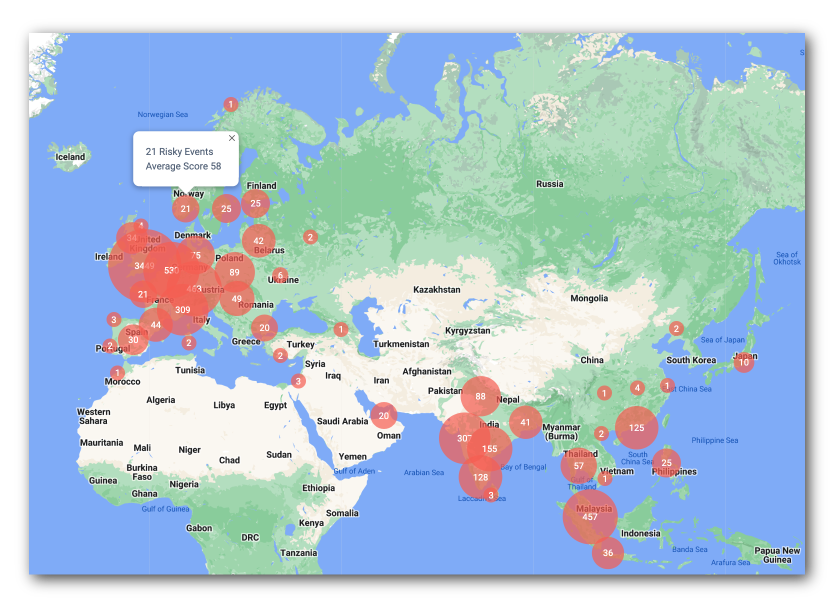
In the right column, the Risk dashboard displays a world map with the number of risky events in each circle. By default, the dashboard displays all risk scores of 50 and above. You can change this setting by change the risk_score_threshold value in the Risk Configuration. Refer to Configure the risk settings.
You can click and drag directly on the map to access events in other countries. If you click one of the red numbers, the dashboard displays a summary of risky events and the average risk score associated with those events.
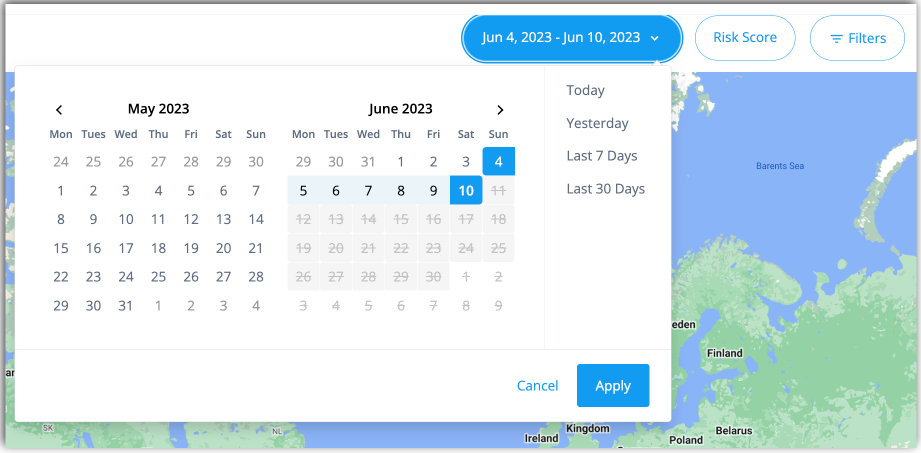
Filtering by date range
You can filter the display and risky events in a number of useful ways. If you select the Date filter, you can filter the dashboard to display only certain dates and ranges. The options are:
-
Today: Display only events occurring today.
-
This Week: Display only the events occurring this week.
-
This Month: Display only the events occurring this month.
-
Custom: Display the events based on your selected calendar date range.
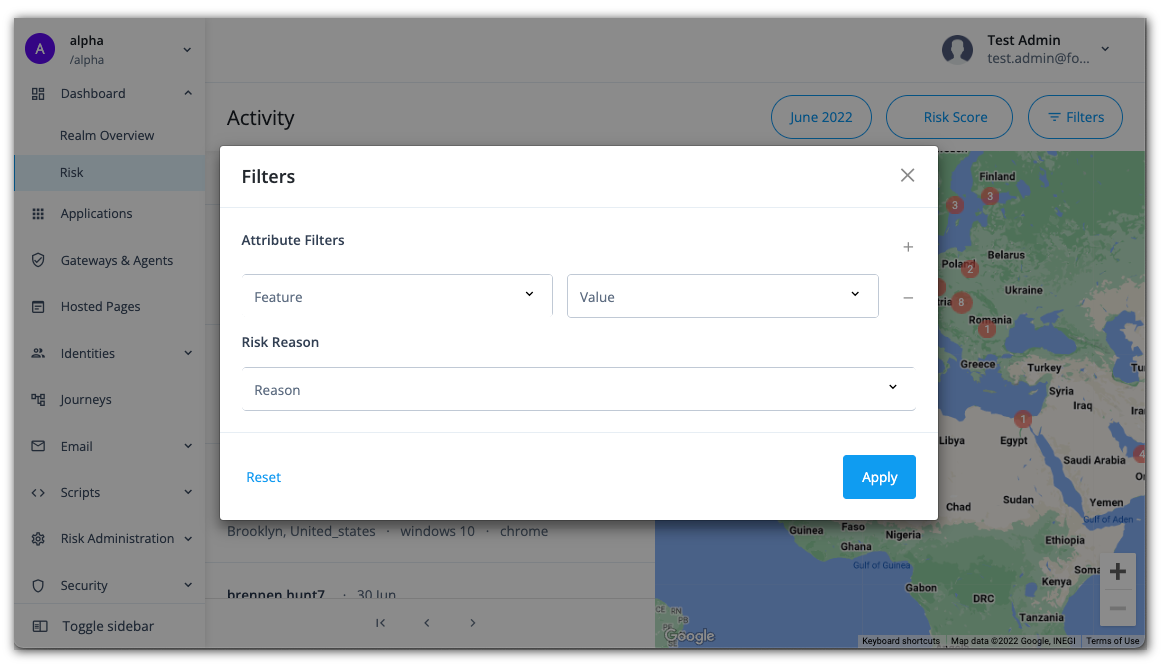
Use advanced filtering
The Risk dashboard supports advanced filtering based on attribute type and value as well as heuristic filter. The attributes are derived from the information in the user agent string. The AI/ML jobs use the heuristics occurring in the selected timeframe.
-
On the Risk dashboard, click Filters. A filters popup window appears.
-
Under Attribute Filters, click the Feature drop-down list, and select one of the following attributes:
Attribute Description City
City where the risky event occurred, for example
BristolorToronto.Country
Country where the risky event occurred, for example
United States,Singapore, orGreat Britain.Device
Device that may have made the risky action, for example
iPad,Mac, orOther.Device Type
Device type of the system that made the risky action, for example
Apple,orSamsung.OS
Operating system of the computer, for example
iOS,Linux, orAndroid.OS Version
Operating system version, for example
10,11, or14.Time of Day
Timestamp of the risk event.
User Agent
User-Agent request header lets servers identify the browser and operating system to the web server.
User ID
User ID of the account that may have been compromised.
-
Enter a value for the attribute filter you created in the previous step.
-
Click the Risk Reason menu to select one of the following heuristics:
Heuristic Description Automated User Agent
A detected threat where an automated bot is in the user-agent string.
Brute Force
A detected threat where direct users are failing multiple authentication attempts.
Credential Stuffing
A detected threat where an IP address is attempting to access a number of different users in a period of time.
Distributed Attack
A detected threat where the total number of unique IP addresses making authentication attempts exceeds a predetermined threshold within a specified time frame.
Impossible Travel
A detected threat where an attacker runs multiple authentication attempts from various locations in a short time span, making such travel impossible for a single person.
IP Blocklist
A detected threat where the user’s IP address is on the Block IP Address list.
Suspicious IP
A detected threat where a user at an IP address is making many authentication attempts over a period of time.
Unusual Browser
A detected threat where a user at an IP address is making authentication attempts on a different browser.
Unusual City
A detected threat where a user at an IP address is making authentication attempts at a different city.
Unusual Country
A detected threat where a user at an IP address is making authentication attempts in a different country.
-
When done, click Apply. The Risk dashboard displays only those criteria that matches your filter.
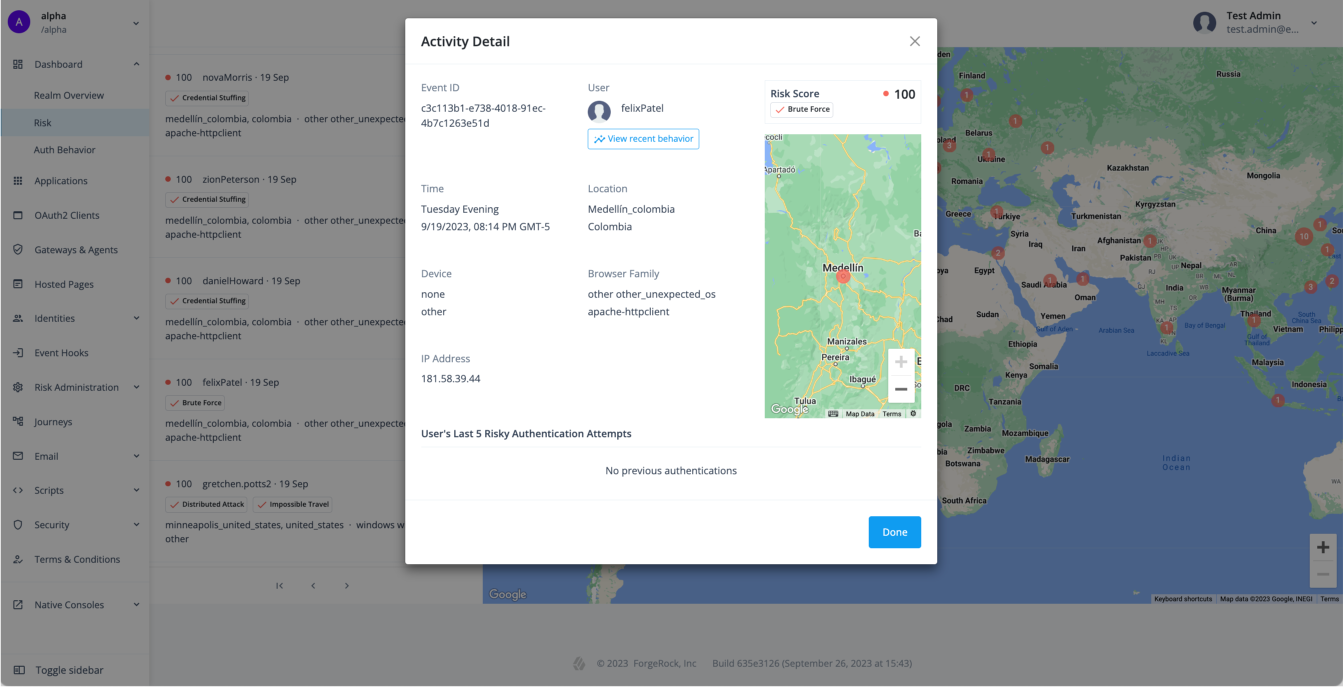
Access risk activity detail
To investigate a particular risk event, click the activity event in the left-hand column. The Activity Detail popup window displays the specific details of the event including transaction ID, user, risk score, time, location, device, IP, and user agent plus a map of where the activity took place.
The popup window also lists the user’s last five risky authentication attempts and the possible type of heuristic discovered (for example, Automated User Agent). Any category that differs from normal behavior is marked with "Unusual <category>" (for example, "Unusual City").
Get the user access behavior
Autonomous Access provides two innovative UI features: User access behavior and Tenant access behavior pages. These UIs pages provide insights into the typical authentication behavior for a specific user and for all users in the tenant.
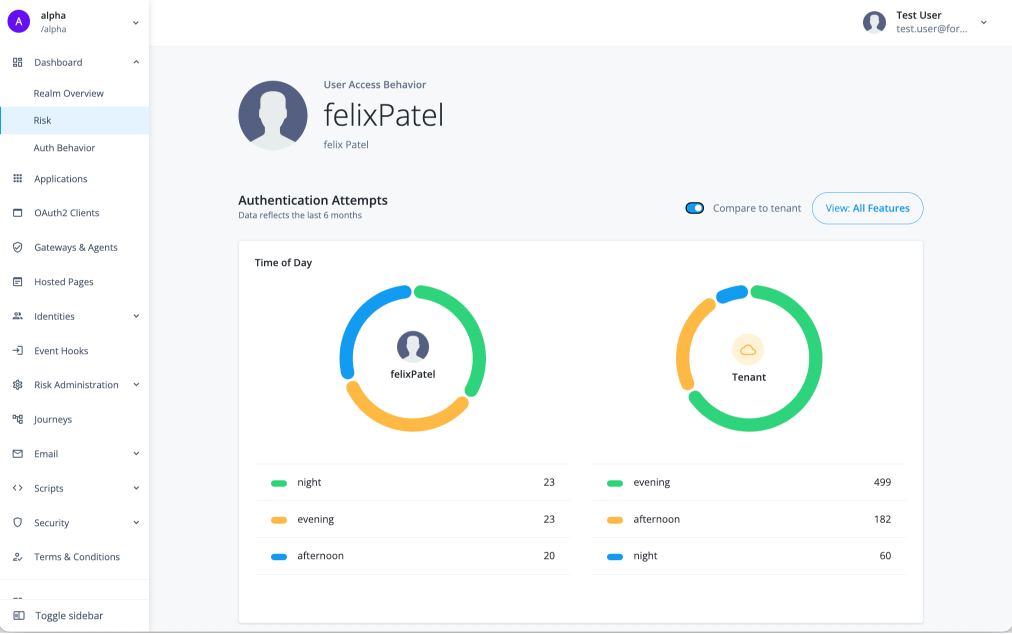
User access behavior provides administrators with a comprehensive graphical overview of a user’s typical authentication attempts over the past six months. The User access behavior page lets administrators gain insights into their users' typical login attempt patterns, making it easier to spot and respond to any irregularities swiftly. An additional feature lets administrators compare a user’s authentication behavior to that of all users in the tenant.
+
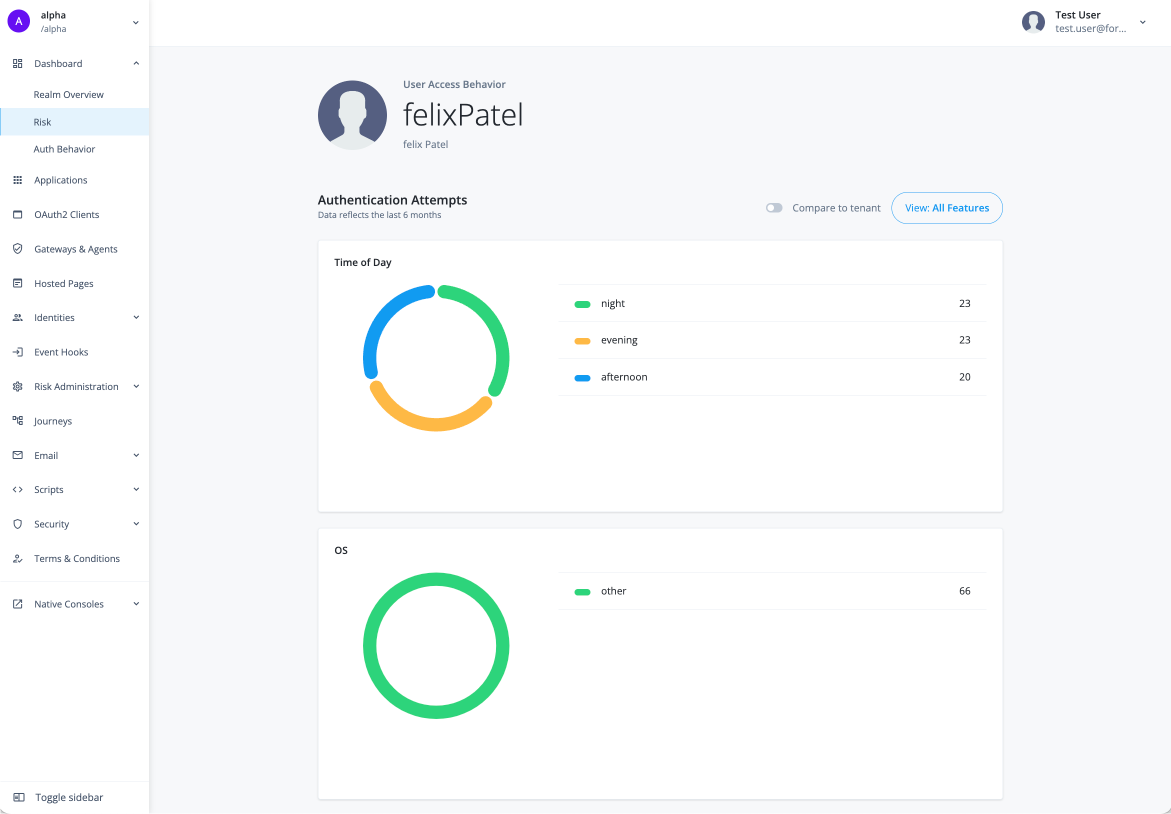
The User access behavior page displays the typical behavior for a specific user in a tenant for the past six months.
-
Log in to your tenant.
-
On the Advanced Identity Cloud admin UI, click Risk to access the Risk dashboard.
-
On the Risk dashboard, under Activity, select a specific user to display the user’s Activity Detail page.
-
On the Activity Detail page, click View recent behavior under the user’s username.
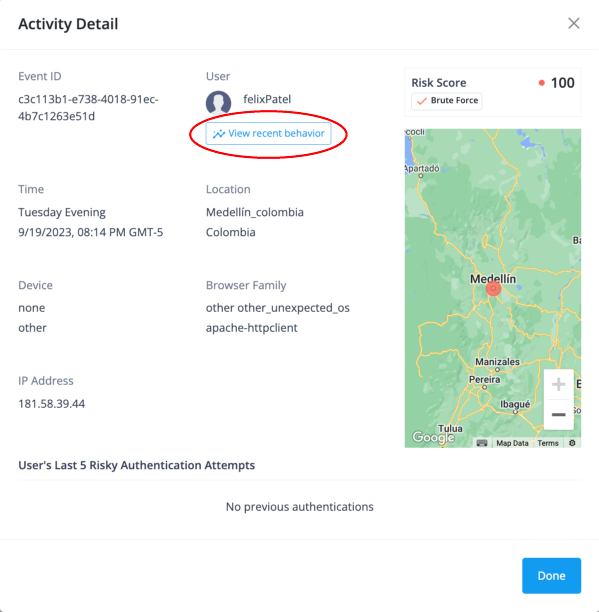
The User Access Behavior page appears.
-
You can compare the user’s typical authentication attempts statistics to that of all users in the tenant. Click Compare to tenant.
The User Access Behavior page displays the user’s typical authentication attempts behavior on the left-hand side and all users' access attempts behavior on the right-hand side.
Get the tenant access behavior
Tenant access behavior provides administrators a comprehensive graphical overview of authentication attempts considered typical for all users in the tenant over the past six months. This page proves valuable when pinpointing policy anomalies by contrasting them with the usual authentication behaviors of your tenant’s users. For example, administrators can use this page when multiple individuals are violating an IT policy that restricts the use of personal computing devices.
+
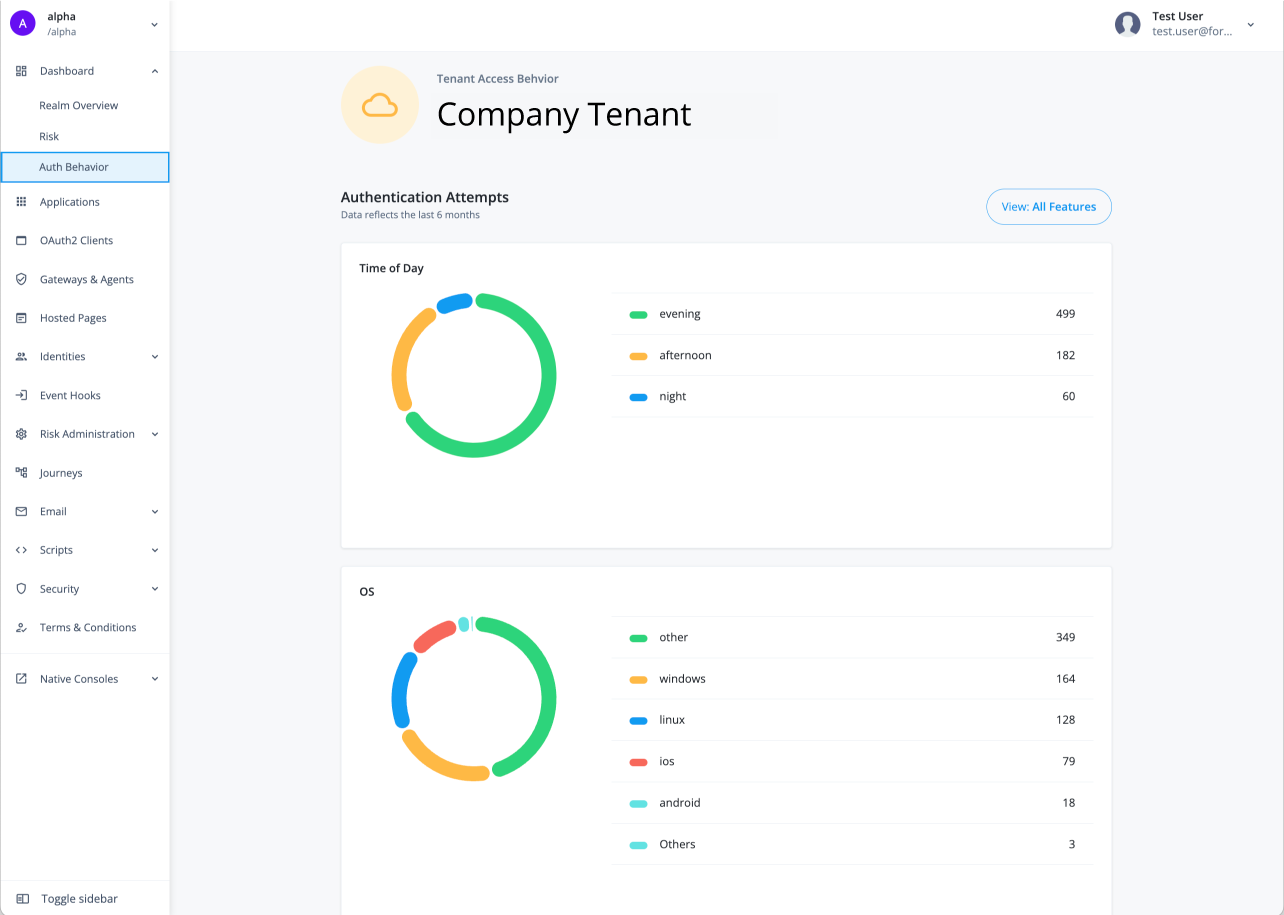
The Tenant access behavior page displays the typical behavior of all users in a tenant for the past six months.
-
On the Advanced Identity Cloud admin UI, click Dashboard > Auth behavior.
Learn about the available categories
Both the User access behavior and Tenant access behavior pages display the "typical" access information for the following categories:
| Stat | Description |
|---|---|
Time of Day |
Time indicator based on the hour and specific to each region as to when the user(s) attempted a login:
|
OS |
Indicator for the typical operating system when the user(s) attempted a login.
|
Device |
Indicator for what device was used at login.
|
Day of week |
Indicator for the typical day users log in:
|
Country |
Indicator for the country where the login typically occurs. Examples are:
|
City |
Indicator for the city and country that the login typically occurs. Examples are:
|
Browser |
Indicator for the typical browser type used at login.
|
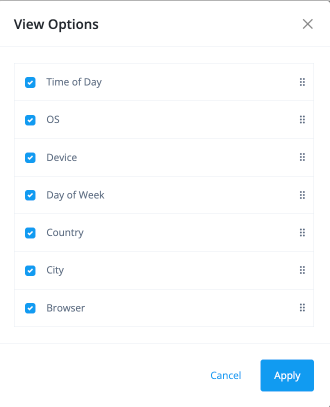
Filter viewable categories
You can filter the viewable categories on the User Access Behavior and Tenant Access Behavior pages as needed.
-
On the user’s User Access Behavior (or Tenant Access Behavior) page, click View All Features.
-
On the View Options modal, click or clear a specific category, and then click Apply.
The User Access Behavior or Tenant Access Behavior page displays the categories you enabled accordingly.